## Line Chart: Energy Consumption Over Time
### Overview
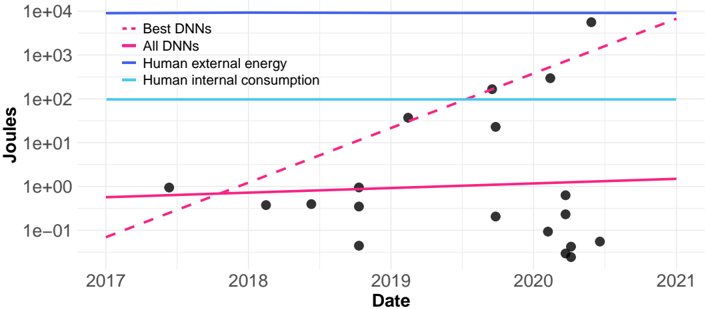
This line chart depicts the energy consumption of Deep Neural Networks (DNNs) and humans over time, from 2017 to 2021. The chart compares the energy usage of "Best DNNs", "All DNNs", "Human external energy", and "Human internal consumption". The Y-axis represents energy in Joules on a logarithmic scale, and the X-axis represents the date.
### Components/Axes
* **X-axis:** Date, ranging from 2017 to 2021.
* **Y-axis:** Joules, on a logarithmic scale (1e+00 to 1e+04).
* **Lines/Data Series:**
* "Best DNNs" (dashed red line)
* "All DNNs" (solid magenta line)
* "Human external energy" (solid blue line)
* "Human internal consumption" (solid cyan line)
* **Data Points:** Black circles representing individual data points.
* **Legend:** Located in the top-left corner, associating colors with each data series.
### Detailed Analysis
The chart shows a clear divergence in energy consumption trends.
* **Best DNNs (dashed red line):** This line exhibits a strong upward trend, increasing exponentially from approximately 0.05 Joules in 2017 to approximately 1000 Joules in 2021.
* **All DNNs (solid magenta line):** This line is relatively flat, fluctuating around 1 Joule throughout the period. There is a slight downward trend towards the end of the period.
* **Human external energy (solid blue line):** This line is nearly flat, remaining consistently around 10000 Joules throughout the period.
* **Human internal consumption (solid cyan line):** This line is also nearly flat, remaining consistently around 100 Joules throughout the period.
* **Data Points (black circles):** These points are scattered around the "All DNNs" line, with some variation. There is a cluster of points around 2020 that show a decrease in energy consumption.
Approximate data points (reading from the chart, with uncertainty due to the logarithmic scale and point size):
| Date | Best DNNs (Joules) | All DNNs (Joules) | Human external energy (Joules) | Human internal consumption (Joules) |
|---|---|---|---|---|
| 2017 | ~0.05 | ~0.8 | ~10000 | ~100 |
| 2018 | ~0.2 | ~1.2 | ~10000 | ~100 |
| 2019 | ~1 | ~0.9 | ~10000 | ~100 |
| 2020 | ~10 | ~0.7 | ~10000 | ~100 |
| 2021 | ~1000 | ~0.5 | ~10000 | ~100 |
### Key Observations
* The energy consumption of the "Best DNNs" is increasing dramatically, while the energy consumption of "All DNNs" remains relatively stable.
* Human energy consumption (both external and internal) is significantly higher than DNN energy consumption, but remains relatively constant.
* The data points for "All DNNs" show some variability, but generally cluster around a consistent energy level.
* There is a noticeable decrease in the data points around 2020, suggesting a potential dip in energy consumption for some DNNs.
### Interpretation
The chart demonstrates a significant and rapidly increasing energy demand from the most advanced DNNs. While the average energy consumption of all DNNs remains relatively low, the "Best DNNs" are exhibiting exponential growth in energy usage. This suggests that as DNNs become more powerful, their energy requirements are increasing at an alarming rate.
The relatively constant energy consumption of humans, in comparison, highlights the growing energy footprint of artificial intelligence. The disparity between the two trends raises concerns about the sustainability of increasingly complex AI models. The slight downward trend in "All DNNs" towards 2021 could indicate improvements in energy efficiency for some models, but this is not enough to offset the dramatic increase in energy consumption of the "Best DNNs". The clustering of data points around 2020 suggests a possible event or change in methodology that affected the energy consumption of several DNNs. Further investigation would be needed to understand the cause of this dip.