## Diagram: Ensemble of Feedforward Neural Networks (FNN)
### Overview
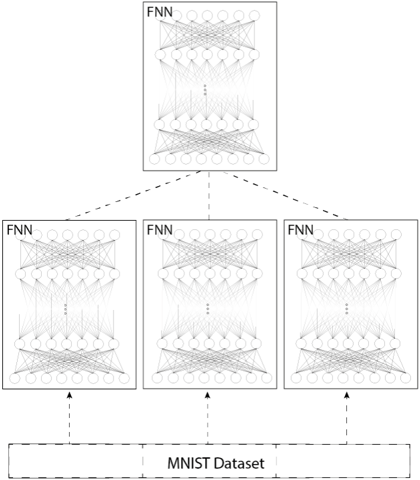
The image depicts a diagram of an ensemble of feedforward neural networks (FNNs) being trained on the MNIST dataset. The diagram shows three FNNs receiving input from the MNIST dataset, and their outputs are combined into a single FNN.
### Components/Axes
* **MNIST Dataset:** A rectangular box at the bottom of the diagram labeled "MNIST Dataset". This represents the input data source.
* **FNNs (Bottom Layer):** Three rectangular boxes, each labeled "FNN" in the top-left corner. Each box contains a simplified representation of a feedforward neural network, showing interconnected nodes arranged in layers.
* **FNN (Top Layer):** A single rectangular box at the top of the diagram, also labeled "FNN" in the top-left corner. This represents another feedforward neural network, presumably combining the outputs of the three FNNs in the bottom layer.
* **Connections:** Dashed arrows indicate the flow of data. Arrows point from the MNIST Dataset to each of the three FNNs in the bottom layer. Dashed lines also connect the three FNNs in the bottom layer to the single FNN in the top layer.
* **Nodes and Connections within FNNs:** Each FNN is represented by circles (nodes) arranged in layers, with lines connecting nodes in adjacent layers. The number of nodes per layer appears to vary. The connections between nodes are represented by thin gray lines.
### Detailed Analysis
* **MNIST Dataset:** The MNIST dataset serves as the input to the system.
* **Bottom Layer FNNs:** Each of the three FNNs in the bottom layer receives the MNIST dataset as input. The internal structure of each FNN consists of multiple layers of interconnected nodes. The number of nodes in each layer appears to decrease from input to output.
* **Top Layer FNN:** The outputs of the three FNNs in the bottom layer are fed into the single FNN in the top layer. This FNN likely combines the outputs of the three individual networks to produce a final prediction.
* **Network Structure:** The FNNs are represented as having multiple layers. The number of nodes in each layer varies, but generally decreases as the data flows through the network. The connections between nodes are dense, indicating that each node in one layer is connected to most or all nodes in the adjacent layer.
### Key Observations
* The diagram illustrates an ensemble learning approach, where multiple FNNs are trained on the same dataset and their outputs are combined.
* The use of three FNNs in the bottom layer suggests a potential for parallel processing or distributed training.
* The diagram is a high-level representation and does not provide specific details about the architecture of the FNNs (e.g., number of layers, number of nodes per layer, activation functions).
### Interpretation
The diagram represents a system for training a machine learning model using an ensemble of feedforward neural networks. The MNIST dataset is used as input, and the outputs of multiple FNNs are combined to improve the overall performance of the model. This approach can potentially improve accuracy and robustness compared to using a single FNN. The diagram highlights the flow of data and the relationships between the different components of the system. The ensemble method is used to improve the performance of the model by reducing variance and bias.