\n
## Box Plot: Score Distribution by Metric
### Overview
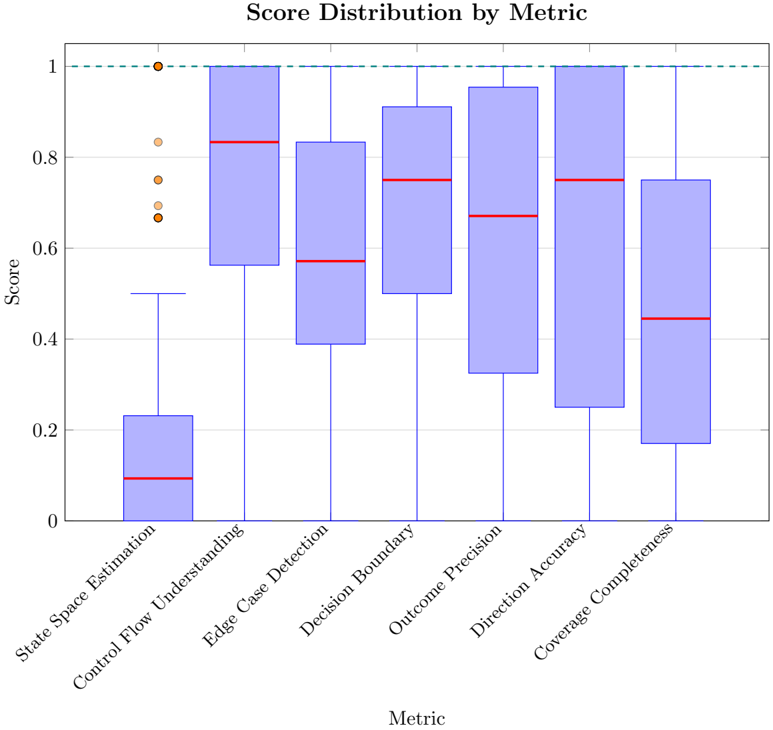
The image presents a series of box plots visualizing the distribution of scores for different metrics. The x-axis represents the metrics, and the y-axis represents the score, ranging from 0 to 1. Each box plot displays the median, quartiles, and potential outliers for each metric. A horizontal dashed line at y=1 is present.
### Components/Axes
* **Title:** "Score Distribution by Metric" (positioned at the top-center)
* **X-axis Label:** "Metric" (positioned at the bottom-center)
* **Y-axis Label:** "Score" (positioned on the left-center)
* **Y-axis Scale:** Ranges from 0 to 1, with markings at 0, 0.2, 0.4, 0.6, 0.8, and 1.
* **Metrics (X-axis Categories):**
1. State Space Estimation
2. Control Flow Understanding
3. Edge Case Detection
4. Decision Boundary
5. Outcome Precision
6. Direction Accuracy
7. Coverage Completeness
* **Horizontal Line:** Dashed line at y=1.
### Detailed Analysis
Each metric has a corresponding box plot. The box plots show the following approximate values:
1. **State Space Estimation:**
* Minimum Score: ~0.05
* First Quartile (Q1): ~0.15
* Median (Q2): ~0.20
* Third Quartile (Q3): ~0.25
* Maximum Score: ~0.35
2. **Control Flow Understanding:**
* Minimum Score: ~0.55
* First Quartile (Q1): ~0.65
* Median (Q2): ~0.75
* Third Quartile (Q3): ~0.85
* Maximum Score: ~0.95
* Outliers: ~0.70, ~0.75, ~0.80
3. **Edge Case Detection:**
* Minimum Score: ~0.60
* First Quartile (Q1): ~0.70
* Median (Q2): ~0.80
* Third Quartile (Q3): ~0.90
* Maximum Score: ~0.95
4. **Decision Boundary:**
* Minimum Score: ~0.35
* First Quartile (Q1): ~0.45
* Median (Q2): ~0.55
* Third Quartile (Q3): ~0.70
* Maximum Score: ~0.80
5. **Outcome Precision:**
* Minimum Score: ~0.50
* First Quartile (Q1): ~0.60
* Median (Q2): ~0.70
* Third Quartile (Q3): ~0.85
* Maximum Score: ~0.95
6. **Direction Accuracy:**
* Minimum Score: ~0.35
* First Quartile (Q1): ~0.45
* Median (Q2): ~0.55
* Third Quartile (Q3): ~0.65
* Maximum Score: ~0.75
7. **Coverage Completeness:**
* Minimum Score: ~0.35
* First Quartile (Q1): ~0.45
* Median (Q2): ~0.55
* Third Quartile (Q3): ~0.70
* Maximum Score: ~0.85
### Key Observations
* "Control Flow Understanding" exhibits the highest median score (~0.75) and generally the highest scores overall.
* "State Space Estimation" has the lowest median score (~0.20) and the narrowest interquartile range, indicating less variability.
* "Decision Boundary", "Direction Accuracy", and "Coverage Completeness" have similar score distributions, with medians around 0.55.
* "Control Flow Understanding" has several outliers above the upper quartile.
* The horizontal line at y=1 serves as a potential benchmark or target score.
### Interpretation
The box plots demonstrate significant variation in performance across different metrics. "Control Flow Understanding" appears to be the strongest area, while "State Space Estimation" is the weakest. The spread of scores within each box plot indicates the consistency of performance for each metric. The outliers in "Control Flow Understanding" suggest that some instances perform exceptionally well in this area. The horizontal line at y=1 could represent a desired performance level, and the data shows that none of the metrics consistently reach this level. The differences in the distributions suggest that different aspects of the system being evaluated require varying levels of attention and improvement. The data suggests that the system is more reliable at understanding control flow than estimating state space. The presence of outliers indicates that there are specific cases where the system performs significantly better than average, which could be worth investigating to understand the underlying factors contributing to this success.