## Diagram: Cyclic System with Inverse Element
### Overview
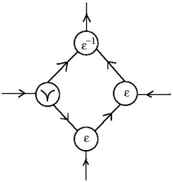
The image depicts a directed cyclic graph with four nodes arranged in a diamond (quadrilateral) structure. Arrows indicate directional flow between nodes, forming a closed loop. Labels on nodes include the Greek letter epsilon (ε) and its inverse (ε⁻¹).
### Components/Axes
- **Nodes**:
- Top node: Labeled **ε⁻¹** (inverse epsilon).
- Right node: Labeled **ε**.
- Bottom node: Labeled **ε**.
- Left node: Labeled **ε** (with a bifurcation symbol, resembling a "Y" or split).
- **Edges**:
- Arrows connect nodes in a clockwise cycle:
1. **ε⁻¹ → ε** (top to right).
2. **ε → ε** (right to bottom).
3. **ε → ε** (bottom to left).
4. **ε → ε⁻¹** (left to top).
- **Legend**: None explicitly visible.
### Detailed Analysis
- **Node Labels**:
- Three nodes are labeled **ε**, while one node is labeled **ε⁻¹**. The inverse notation (ε⁻¹) suggests a mathematical or operational relationship (e.g., multiplicative inverse, reverse process).
- The left node’s bifurcation symbol may imply a branching or dual-path mechanism in the system.
- **Flow Direction**:
- The cycle is unidirectional, with all edges pointing clockwise. This implies a deterministic or sequential process.
- The inverse element (ε⁻¹) acts as both a starting and ending point, creating a feedback loop.
### Key Observations
1. **Cyclic Dependency**: The system forms a closed loop, indicating interdependence between nodes.
2. **Inverse Element**: The presence of ε⁻¹ suggests a reversal or balancing mechanism within the cycle.
3. **Bifurcation**: The left node’s split symbol could represent divergence in pathways or states.
### Interpretation
This diagram likely represents a theoretical or mathematical system where:
- **ε** denotes a standard state or operation.
- **ε⁻¹** represents an inverse or compensatory action, critical for maintaining equilibrium in the cycle.
- The bifurcation at the left node may indicate a decision point or parallel processing step.
The closed-loop structure implies that the system is self-sustaining, with outputs feeding back into inputs. The inverse element (ε⁻¹) could symbolize a corrective or stabilizing force, ensuring the cycle persists without external intervention. The bifurcation introduces complexity, suggesting potential for multiple outcomes or states within the system.
No numerical data or quantitative trends are present; the focus is on structural relationships and symbolic labels.