## Line Graphs: Performance Comparison of Late-Init and Early-Init Across Token Ranges
### Overview
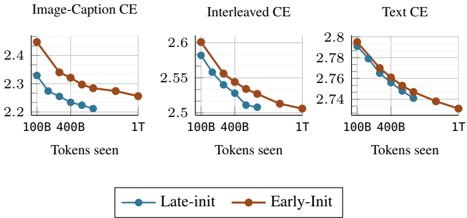
The image contains three line graphs comparing the performance of two initialization strategies ("Late-Init" and "Early-Init") across three categories: **Image-Caption CE**, **Interleaved CE**, and **Text CE**. Each graph plots performance metrics (y-axis) against token ranges (x-axis: 100B, 400B, 1T). Both strategies show declining performance values as token counts increase, with "Early-Init" consistently outperforming "Late-Init" across all categories.
### Components/Axes
- **X-axis**: "Tokens seen" with markers at 100B, 400B, and 1T.
- **Y-axis**: Performance metric (no explicit label, values range from ~2.2 to 2.8).
- **Legend**: Located at the bottom center, with:
- **Blue circles**: "Late-Init"
- **Red circles**: "Early-Init"
- **Graph Layout**: Three separate line graphs arranged horizontally, each corresponding to one CE category.
### Detailed Analysis
#### Image-Caption CE
- **Late-Init**: Starts at ~2.3 (100B tokens), decreases to ~2.25 (400B), and ~2.2 (1T).
- **Early-Init**: Starts at ~2.4 (100B), decreases to ~2.35 (400B), and ~2.3 (1T).
- **Trend**: Both lines slope downward, with Early-Init maintaining a ~0.1 higher value throughout.
#### Interleaved CE
- **Late-Init**: Starts at ~2.55 (100B), decreases to ~2.5 (400B), and ~2.45 (1T).
- **Early-Init**: Starts at ~2.6 (100B), decreases to ~2.55 (400B), and ~2.5 (1T).
- **Trend**: Similar downward slope, with Early-Init consistently outperforming by ~0.05–0.1.
#### Text CE
- **Late-Init**: Starts at ~2.78 (100B), decreases to ~2.74 (400B), and ~2.7 (1T).
- **Early-Init**: Starts at ~2.8 (100B), decreases to ~2.76 (400B), and ~2.72 (1T).
- **Trend**: Largest absolute gap (~0.04–0.08) between strategies, narrowing slightly at 1T.
### Key Observations
1. **Consistent Performance Gap**: Early-Init outperforms Late-Init in all categories, with the gap widening in Text CE.
2. **Diminishing Returns**: Performance improvements slow as token counts increase (e.g., Image-Caption CE drops ~0.1 across all tokens).
3. **Narrowing Gap in Text CE**: The performance difference between strategies is smallest in Text CE (~0.06 at 1T vs. ~0.1 in other categories).
### Interpretation
The data suggests that **Early-Init** provides a stronger initial performance advantage, likely due to better parameter initialization or training stability. However, the narrowing gap in Text CE implies that **Late-Init** may adapt more effectively with sufficient data, potentially closing the performance disparity. This could reflect trade-offs between initialization efficiency and long-term adaptability, with implications for resource allocation in training pipelines. The consistent decline in performance values across all categories indicates that increasing token counts generally improves outcomes, but the rate of improvement plateaus at higher scales.