\n
## Question/Diagram: Hypogammaglobulinemia Mechanisms
### Overview
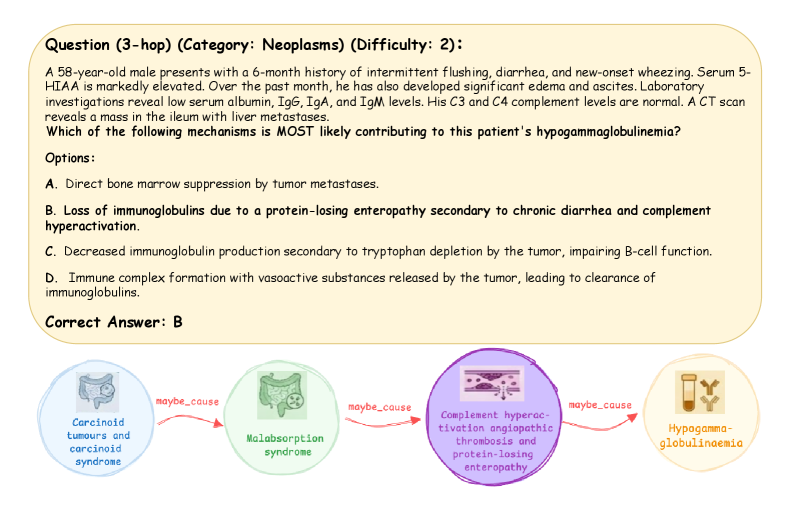
The image presents a medical question regarding the causes of hypogammaglobulinemia in a 58-year-old male patient, along with multiple-choice options and a diagram illustrating potential causal relationships between different medical conditions. The correct answer is indicated as option B.
### Components/Axes
The image contains the following components:
* **Question Text:** A detailed patient case description.
* **Options:** Four multiple-choice answers (A, B, C, D).
* **Correct Answer:** Highlighted as "B".
* **Diagram:** A circular diagram with four interconnected nodes representing medical conditions.
* **Node Labels:** Each node is labeled with a specific condition.
* **Connecting Arrows:** Arrows labeled "maybe_cause" connect the nodes, indicating potential causal relationships.
### Content Details
**Question Text:**
"A 58-year-old male presents with a 6-month history of intermittent flushing, diarrhea, and new-onset wheezing. Serum 5-HIAA is markedly elevated. Over the past month, he has also developed significant edema and ascites. Laboratory investigations reveal low serum albumin, IgG, IgA, and IgM levels. His C3 and C4 complement levels are normal. A CT scan reveals a mass in the ileum with liver metastases. Which of the following mechanisms is MOST likely contributing to this patient's hypogammaglobulinemia?"
**Options:**
A. Direct bone marrow suppression by tumor metastases.
B. Loss of immunoglobulins due to a protein-losing enteropathy secondary to chronic diarrhea and complement hyperactivation.
C. Decreased immunoglobulin production secondary to tryptophan depletion by the tumor, impairing B-cell function.
D. Immune complex formation with vasoactive substances released by the tumor, leading to clearance of immunoglobulins.
**Diagram Details:**
The diagram consists of four nodes arranged in a circular fashion, connected by arrows labeled "maybe_cause".
* **Node 1 (Bottom-Left):** "Carcinoid tumours and carcinoid syndrome" - Represented by a brain icon.
* **Node 2 (Left):** "Malabsorption syndrome" - Represented by an intestine icon.
* **Node 3 (Right):** "Complement hyperactivation angiopatic thrombosis and protein-losing enteropathy" - Represented by a blood vessel icon.
* **Node 4 (Bottom-Right):** "Hypogammaglobulinemia" - Represented by a vial icon.
The arrows indicate the following potential causal relationships:
* Carcinoid tumours/syndrome -> Malabsorption syndrome
* Malabsorption syndrome -> Complement hyperactivation/protein-losing enteropathy
* Complement hyperactivation/protein-losing enteropathy -> Hypogammaglobulinemia
### Key Observations
* The diagram suggests a chain of events leading to hypogammaglobulinemia, starting with carcinoid tumors and culminating in immunoglobulin loss.
* The "maybe_cause" label indicates that the relationships are not definitively established, but rather represent potential contributing factors.
* The correct answer (B) aligns with the pathway highlighted in the diagram, specifically the role of protein-losing enteropathy in immunoglobulin loss.
### Interpretation
The image presents a clinical reasoning scenario. The question tests the understanding of the mechanisms underlying hypogammaglobulinemia in the context of a complex clinical presentation. The diagram serves as a visual aid to illustrate the potential pathways involved, emphasizing the role of gastrointestinal dysfunction (malabsorption and protein-losing enteropathy) as a key contributor. The use of "maybe_cause" acknowledges the complexity of the disease process and the possibility of multiple contributing factors. The correct answer (B) highlights the importance of considering protein-losing enteropathy, which is consistent with the patient's symptoms (diarrhea, edema, ascites) and laboratory findings (low serum albumin, immunoglobulins). The diagram is a simplified representation of a complex biological system, and the relationships depicted should be interpreted with caution. The diagram's structure suggests a causal chain, but correlation does not equal causation. The diagram is a visual aid to help understand the potential mechanisms, but it does not provide definitive proof of causality.