## Line Charts: Llama-3-8B and Llama-3-70B Performance
### Overview
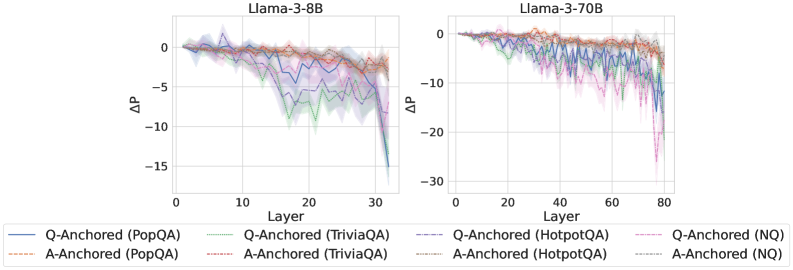
The image presents two line charts comparing the performance of Llama-3-8B and Llama-3-70B models across different layers. The y-axis represents ΔP (change in performance), and the x-axis represents the layer number. Each chart displays six data series, representing Q-Anchored and A-Anchored performance on PopQA, TriviaQA, HotpotQA, and NQ datasets. The charts show how performance changes as the model processes information through its layers.
### Components/Axes
**Chart 1: Llama-3-8B**
* **Title:** Llama-3-8B
* **X-axis:** Layer
* Scale: 0 to 30, incrementing by 10
* **Y-axis:** ΔP
* Scale: -15 to 0, incrementing by 5
* **Legend:** Located at the bottom of the image, spanning both charts.
* Q-Anchored (PopQA): Solid Blue Line
* A-Anchored (PopQA): Dashed Brown Line
* Q-Anchored (TriviaQA): Dotted Green Line
* A-Anchored (TriviaQA): Dash-Dotted Brown Line
* Q-Anchored (HotpotQA): Dash-Dot Blue Line
* A-Anchored (HotpotQA): Dotted Brown Line
* Q-Anchored (NQ): Dash-Dot Pink Line
* A-Anchored (NQ): Dotted Brown Line
**Chart 2: Llama-3-70B**
* **Title:** Llama-3-70B
* **X-axis:** Layer
* Scale: 0 to 80, incrementing by 20
* **Y-axis:** ΔP
* Scale: -30 to 0, incrementing by 10
* **Legend:** (Same as Chart 1, located at the bottom of the image)
### Detailed Analysis
**Chart 1: Llama-3-8B**
* **Q-Anchored (PopQA):** (Solid Blue Line) Starts around 0, fluctuates slightly, then drops sharply to approximately -12 around layer 30.
* **A-Anchored (PopQA):** (Dashed Brown Line) Starts around 0, gradually decreases to approximately -2 around layer 30.
* **Q-Anchored (TriviaQA):** (Dotted Green Line) Starts around 0, gradually decreases to approximately -8 around layer 30.
* **A-Anchored (TriviaQA):** (Dash-Dotted Brown Line) Starts around 0, gradually decreases to approximately -2 around layer 30.
* **Q-Anchored (HotpotQA):** (Dash-Dot Blue Line) Starts around 0, fluctuates slightly, then drops sharply to approximately -12 around layer 30.
* **A-Anchored (HotpotQA):** (Dotted Brown Line) Starts around 0, gradually decreases to approximately -2 around layer 30.
* **Q-Anchored (NQ):** (Dash-Dot Pink Line) Starts around 0, fluctuates slightly, then drops sharply to approximately -12 around layer 30.
* **A-Anchored (NQ):** (Dotted Brown Line) Starts around 0, gradually decreases to approximately -2 around layer 30.
**Chart 2: Llama-3-70B**
* **Q-Anchored (PopQA):** (Solid Blue Line) Starts around 0, fluctuates slightly, then drops sharply to approximately -25 around layer 80.
* **A-Anchored (PopQA):** (Dashed Brown Line) Starts around 0, gradually decreases to approximately -2 around layer 80.
* **Q-Anchored (TriviaQA):** (Dotted Green Line) Starts around 0, gradually decreases to approximately -10 around layer 80.
* **A-Anchored (TriviaQA):** (Dash-Dotted Brown Line) Starts around 0, gradually decreases to approximately -2 around layer 80.
* **Q-Anchored (HotpotQA):** (Dash-Dot Blue Line) Starts around 0, fluctuates slightly, then drops sharply to approximately -25 around layer 80.
* **A-Anchored (HotpotQA):** (Dotted Brown Line) Starts around 0, gradually decreases to approximately -2 around layer 80.
* **Q-Anchored (NQ):** (Dash-Dot Pink Line) Starts around 0, fluctuates slightly, then drops sharply to approximately -25 around layer 80.
* **A-Anchored (NQ):** (Dotted Brown Line) Starts around 0, gradually decreases to approximately -2 around layer 80.
### Key Observations
* For both models, the Q-Anchored data series (PopQA, HotpotQA, and NQ) show a more significant drop in performance (ΔP) as the layer number increases compared to the A-Anchored series.
* The Llama-3-70B model (right chart) exhibits a larger performance drop (ΔP) compared to the Llama-3-8B model (left chart).
* The A-Anchored data series (PopQA, TriviaQA, HotpotQA, and NQ) show a relatively stable performance across all layers for both models.
* The shaded regions around each line indicate the uncertainty or variance in the performance data.
### Interpretation
The charts suggest that as the Llama models process information through deeper layers, the performance on Q-Anchored tasks (PopQA, HotpotQA, NQ) degrades more significantly than on A-Anchored tasks. This could indicate that the model's ability to handle question-related information diminishes with increasing depth, while its ability to handle answer-related information remains relatively stable.
The larger performance drop in Llama-3-70B compared to Llama-3-8B could be attributed to the increased complexity and depth of the larger model. While larger models often have greater capacity, they may also be more susceptible to issues like vanishing gradients or overfitting, leading to performance degradation in deeper layers.
The relatively stable performance of A-Anchored tasks suggests that the model maintains a consistent understanding or representation of answer-related information throughout its layers. This could be due to the nature of the tasks or the way the model is trained.