\n
## Charts: Average Regret vs. Chain Length
### Overview
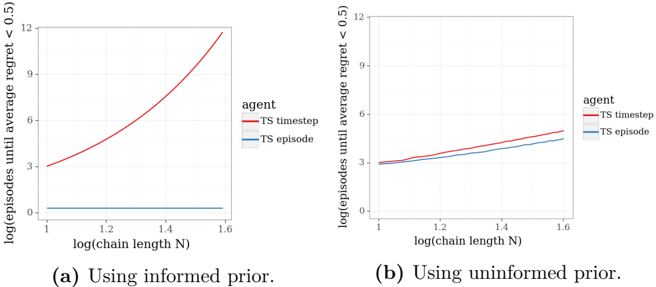
The image presents two charts comparing the average regret of two agents, "TS timestep" and "TS episode", as a function of the logarithm of the chain length (N). The left chart (a) shows results using an informed prior, while the right chart (b) shows results using an uninformed prior. Both charts share the same x-axis scale, but differ in their y-axis scales and the behavior of the plotted lines.
### Components/Axes
Both charts share the following components:
* **X-axis:** labeled "log(chain length N)", ranging from approximately 1.0 to 1.6. The axis is marked with values 1.0, 1.2, 1.4, and 1.6.
* **Y-axis:** labeled "log(average regret < 0.5)" for chart (a) and "log(episodes until average regret < 0.5)" for chart (b).
* **Legend:** Located in the top-right corner of each chart, labeled "agent" with two entries:
* "TS timestep" (represented by a red line)
* "TS episode" (represented by a blue line)
### Detailed Analysis or Content Details
**Chart (a): Using informed prior.**
* **TS timestep (Red Line):** The line slopes sharply upward, indicating a rapid increase in log(average regret) as log(chain length N) increases.
* At N = 1.0, log(average regret) ≈ 3.2
* At N = 1.2, log(average regret) ≈ 4.5
* At N = 1.4, log(average regret) ≈ 6.5
* At N = 1.6, log(average regret) ≈ 11.5
* **TS episode (Blue Line):** The line is nearly flat, remaining close to zero throughout the range of log(chain length N).
* At N = 1.0, log(average regret) ≈ 0.1
* At N = 1.2, log(average regret) ≈ 0.1
* At N = 1.4, log(average regret) ≈ 0.1
* At N = 1.6, log(average regret) ≈ 0.1
**Chart (b): Using uninformed prior.**
* **TS timestep (Red Line):** The line shows a slight upward trend, but the increase is much less pronounced than in chart (a).
* At N = 1.0, log(average regret) ≈ 3.5
* At N = 1.2, log(average regret) ≈ 4.0
* At N = 1.4, log(average regret) ≈ 4.5
* At N = 1.6, log(average regret) ≈ 5.0
* **TS episode (Blue Line):** The line is relatively flat, with a slight upward trend.
* At N = 1.0, log(average regret) ≈ 3.2
* At N = 1.2, log(average regret) ≈ 3.5
* At N = 1.4, log(average regret) ≈ 3.8
* At N = 1.6, log(average regret) ≈ 4.0
### Key Observations
* In chart (a), the "TS timestep" agent exhibits a significantly higher average regret than the "TS episode" agent as the chain length increases.
* In chart (b), the difference in average regret between the two agents is much smaller, and both agents show a relatively modest increase in regret as the chain length increases.
* The informed prior (chart a) leads to a much more pronounced increase in regret for the "TS timestep" agent.
### Interpretation
The data suggests that the choice of prior significantly impacts the performance of the "TS timestep" agent. When an informed prior is used, the agent's regret increases rapidly with chain length, indicating that it struggles to adapt to the environment. However, when an uninformed prior is used, the agent's regret remains relatively low, suggesting that it is more robust to the lack of prior knowledge.
The "TS episode" agent, in contrast, appears to be less sensitive to the choice of prior. Its regret remains low in both charts, indicating that it is able to learn effectively regardless of whether an informed or uninformed prior is used.
The difference in behavior between the two agents may be due to the way they explore the environment. The "TS timestep" agent may rely more heavily on its prior knowledge, which can be detrimental when the prior is inaccurate. The "TS episode" agent, on the other hand, may be more exploratory, allowing it to overcome the limitations of its prior knowledge.
The charts demonstrate the importance of carefully considering the choice of prior when designing reinforcement learning agents. A poorly chosen prior can lead to suboptimal performance, while a well-chosen prior can significantly improve learning efficiency.