## Line Chart: Performance vs. Context Length
### Overview
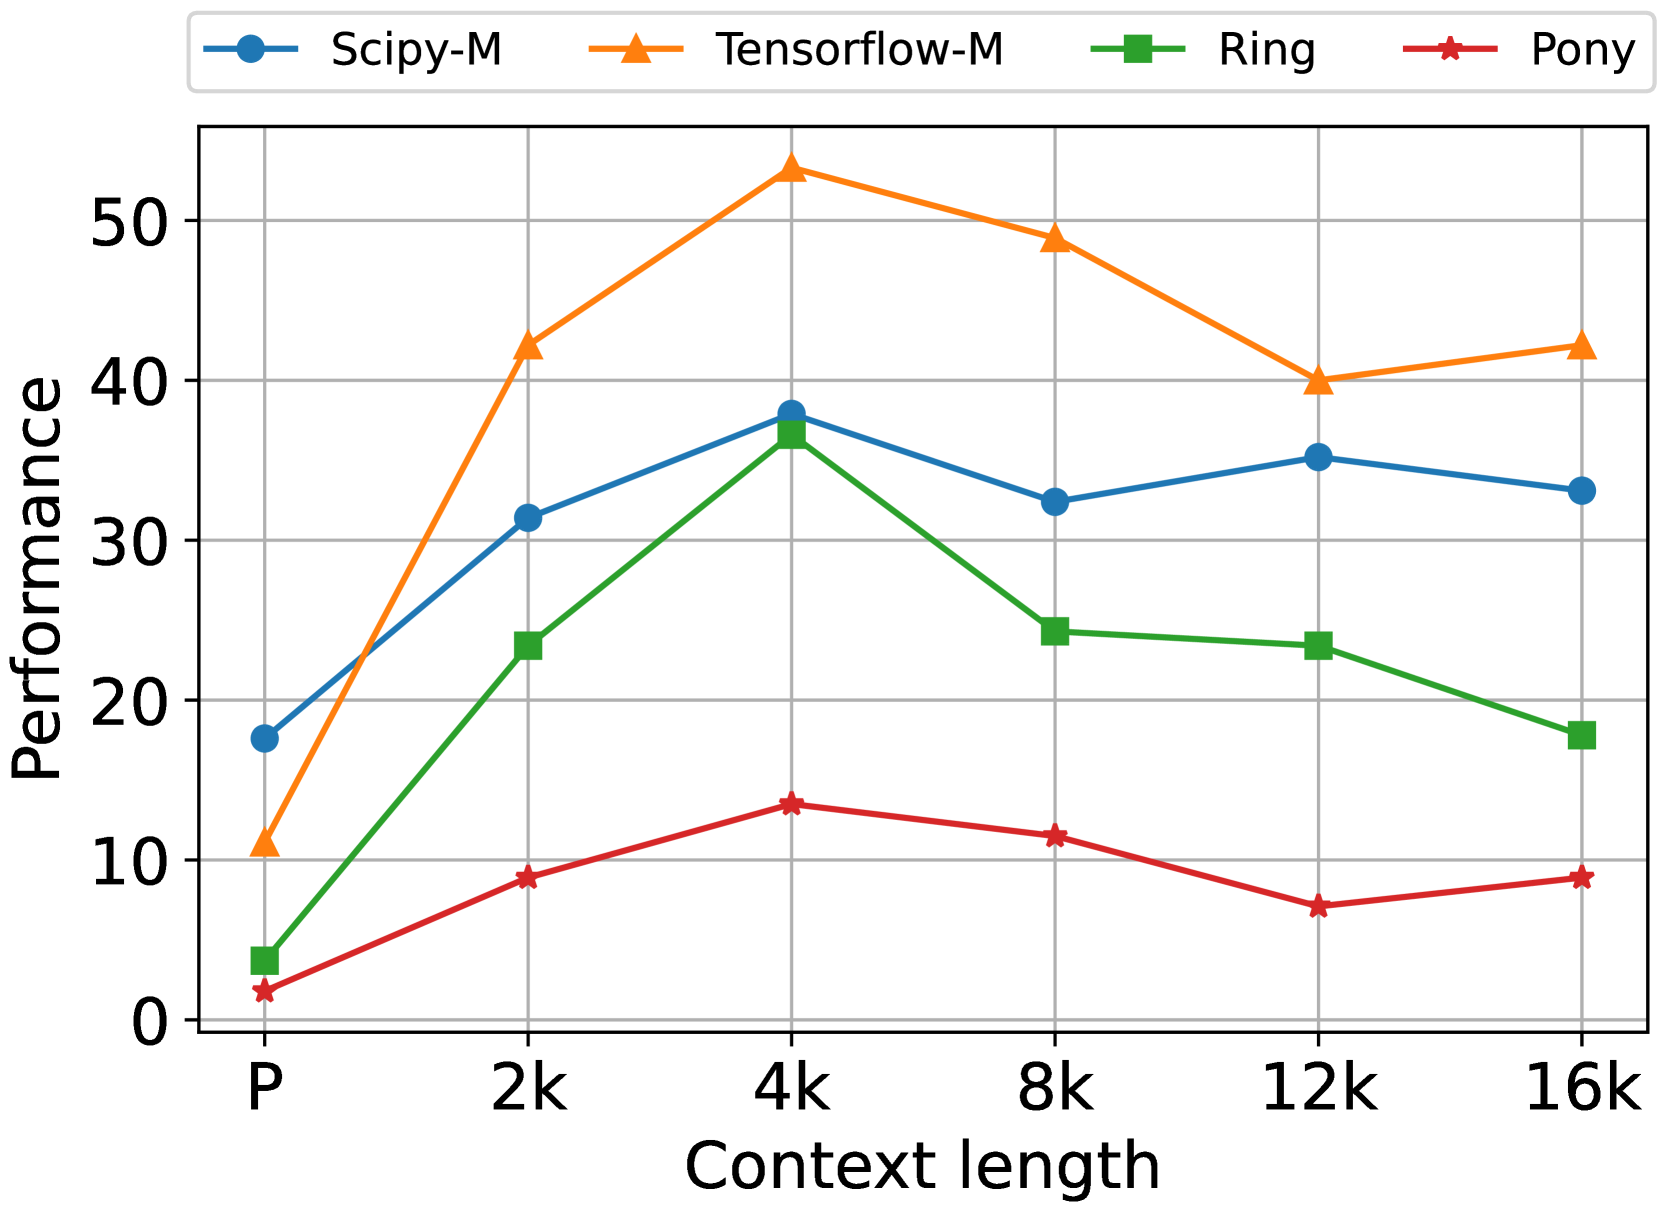
The image is a line chart comparing the performance of four different systems or methods (Scipy-M, Tensorflow-M, Ring, Pony) across varying context lengths. The chart plots "Performance" on the y-axis against "Context length" on the x-axis. The data suggests an evaluation of how these systems scale or handle increasing context sizes, with performance peaking at a mid-range context length for most systems.
### Components/Axes
* **Chart Type:** Line chart with markers.
* **X-Axis (Horizontal):**
* **Label:** "Context length"
* **Categories/Markers:** P, 2k, 4k, 8k, 12k, 16k. (Note: 'P' likely stands for a baseline or 'Prompt' length, while 'k' denotes thousands).
* **Y-Axis (Vertical):**
* **Label:** "Performance"
* **Scale:** Linear, ranging from 0 to approximately 55. Major gridlines are at intervals of 10 (0, 10, 20, 30, 40, 50).
* **Legend:** Located at the top-center of the chart, above the plot area. It defines four data series:
1. **Scipy-M:** Blue line with circle markers.
2. **Tensorflow-M:** Orange line with upward-pointing triangle markers.
3. **Ring:** Green line with square markers.
4. **Pony:** Red line with star (pentagram) markers.
### Detailed Analysis
**Trend Verification & Data Point Extraction (Approximate Values):**
1. **Tensorflow-M (Orange, Triangle):**
* **Trend:** Shows the highest overall performance. It rises sharply from P to 4k, peaks at 4k, then gradually declines with a slight uptick at 16k.
* **Data Points:**
* P: ~11
* 2k: ~42
* 4k: ~53 (Peak)
* 8k: ~49
* 12k: ~40
* 16k: ~42
2. **Scipy-M (Blue, Circle):**
* **Trend:** Rises from P to 4k, dips at 8k, then recovers and stabilizes. It maintains the second-highest performance for most context lengths.
* **Data Points:**
* P: ~18
* 2k: ~31
* 4k: ~38
* 8k: ~32
* 12k: ~35
* 16k: ~33
3. **Ring (Green, Square):**
* **Trend:** Increases from P to a peak at 4k, then experiences a consistent decline as context length increases further.
* **Data Points:**
* P: ~4
* 2k: ~23
* 4k: ~37 (Peak)
* 8k: ~24
* 12k: ~23
* 16k: ~18
4. **Pony (Red, Star):**
* **Trend:** Shows the lowest performance overall. It has a modest peak at 4k and remains relatively flat and low across all context lengths.
* **Data Points:**
* P: ~2
* 2k: ~9
* 4k: ~13 (Peak)
* 8k: ~11
* 12k: ~7
* 16k: ~9
### Key Observations
* **Universal Peak at 4k:** All four systems achieve their maximum measured performance at the "4k" context length.
* **Performance Hierarchy:** A clear and consistent hierarchy is visible for context lengths of 2k and beyond: Tensorflow-M > Scipy-M > Ring > Pony. At the baseline 'P', Scipy-M starts highest.
* **Sensitivity to Scale:** Tensorflow-M and Ring show the most pronounced performance drop after their 4k peak, suggesting they may be less optimized for very long contexts (8k-16k). Scipy-M demonstrates more stable performance across the 8k-16k range.
* **Pony's Low Baseline:** The Pony system starts at a very low performance level and shows minimal improvement, indicating it may be unsuitable for the task being measured or represents a different class of method.
### Interpretation
This chart likely benchmarks the efficiency or accuracy of different computational methods (possibly related to machine learning, numerical computing, or data processing) as the size of the input data (context length) grows.
* **What the data suggests:** There is a "sweet spot" for performance around a context length of 4k for all tested methods. Beyond this point, the overhead of managing larger contexts appears to degrade performance, with varying degrees of resilience across systems.
* **Relationship between elements:** The systems can be grouped by their response to scaling. Tensorflow-M is the high-performance but potentially volatile choice. Scipy-M offers a robust, middle-ground performance. Ring scales poorly beyond mid-length contexts. Pony is consistently outperformed, suggesting it may be a baseline, a legacy system, or designed for a different primary constraint (e.g., minimal memory usage).
* **Notable Anomalies:** The universal peak at 4k is the most striking pattern. It implies a common bottleneck or optimal operational point in the underlying hardware, software stack, or algorithmic complexity for this specific task. The slight recovery of Tensorflow-M and Pony at 16k after a dip at 12k is curious and could indicate a secondary optimization or measurement noise.