## Bar Chart: Adder: Time vs Core count
### Overview
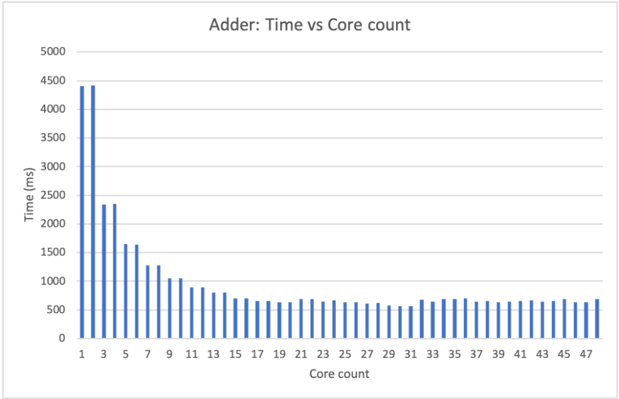
The image is a bar chart titled "Adder: Time vs Core count". It illustrates the relationship between the number of cores used and the time taken for an adder operation. The x-axis represents the core count, ranging from 1 to 47. The y-axis represents the time in milliseconds (ms), ranging from 0 to 5000. The chart shows a general trend of decreasing time with an increasing number of cores, up to a certain point, after which the time plateaus.
### Components/Axes
* **Title:** Adder: Time vs Core count
* **X-axis:**
* Label: Core count
* Scale: 1, 3, 5, 7, 9, 11, 13, 15, 17, 19, 21, 23, 25, 27, 29, 31, 33, 35, 37, 39, 41, 43, 45, 47
* **Y-axis:**
* Label: Time (ms)
* Scale: 0, 500, 1000, 1500, 2000, 2500, 3000, 3500, 4000, 4500, 5000
* **Data Series:**
* The chart contains a single data series represented by blue bars.
### Detailed Analysis
The data series shows the time taken for the adder operation for different core counts.
* **Core Count 1:** Time is approximately 4400 ms.
* **Core Count 3:** Time is approximately 2300 ms.
* **Core Count 5:** Time is approximately 1650 ms.
* **Core Count 7:** Time is approximately 1400 ms.
* **Core Count 9:** Time is approximately 1100 ms.
* **Core Count 11:** Time is approximately 1000 ms.
* **Core Count 13:** Time is approximately 850 ms.
* **Core Count 15:** Time is approximately 750 ms.
* **Core Count 17:** Time is approximately 700 ms.
* **Core Count 19:** Time is approximately 650 ms.
* **Core Count 21:** Time is approximately 650 ms.
* **Core Count 23:** Time is approximately 600 ms.
* **Core Count 25:** Time is approximately 600 ms.
* **Core Count 27:** Time is approximately 600 ms.
* **Core Count 29:** Time is approximately 550 ms.
* **Core Count 31:** Time is approximately 600 ms.
* **Core Count 33:** Time is approximately 650 ms.
* **Core Count 35:** Time is approximately 650 ms.
* **Core Count 37:** Time is approximately 650 ms.
* **Core Count 39:** Time is approximately 650 ms.
* **Core Count 41:** Time is approximately 650 ms.
* **Core Count 43:** Time is approximately 650 ms.
* **Core Count 45:** Time is approximately 650 ms.
* **Core Count 47:** Time is approximately 650 ms.
The time decreases rapidly from 1 core to around 11 cores. After 11 cores, the decrease in time becomes much smaller, and the time plateaus around 600-700 ms.
### Key Observations
* The time taken for the adder operation decreases significantly as the number of cores increases from 1 to approximately 11.
* Beyond 11 cores, the benefit of adding more cores diminishes, and the time plateaus.
* There is a significant drop in time from 1 core to 3 cores.
### Interpretation
The chart demonstrates the performance improvement achieved by parallelizing the adder operation using multiple cores. The initial rapid decrease in time indicates that the operation benefits significantly from parallel processing. However, the plateauing of the time beyond a certain number of cores suggests that there are diminishing returns to adding more cores. This could be due to factors such as communication overhead between cores, limitations in the algorithm's parallelizability, or hardware constraints. The optimal number of cores for this adder operation appears to be around 11, as adding more cores beyond this point does not significantly reduce the execution time.