\n
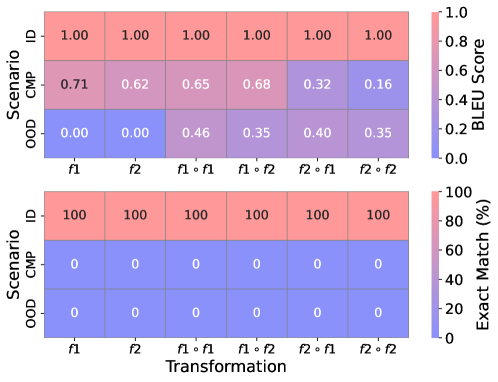
## Heatmap: BLEU Score and Exact Match Percentage
### Overview
The image presents two heatmaps, stacked vertically. The top heatmap displays BLEU scores, while the bottom heatmap shows Exact Match percentages. Both heatmaps share the same x and y axes, representing different transformations and scenarios. The color intensity in each heatmap corresponds to the value of the metric.
### Components/Axes
* **X-axis:** Transformation. Categories are: f1, f2, f1•f1, f1•f2, f2•f1, f2•f2.
* **Y-axis:** Scenario. Categories are: ID, CMP, OOD.
* **Top Heatmap:** BLEU Score. Color scale ranges from 0.0 (blue) to 1.0 (red).
* **Bottom Heatmap:** Exact Match (%). Color scale ranges from 0 (blue) to 100 (red).
* **Legend (Top-Right):** BLEU Score colorbar.
* **Legend (Bottom-Right):** Exact Match (%) colorbar.
### Detailed Analysis or Content Details
**Top Heatmap (BLEU Score):**
* **ID Scenario:**
* f1: 1.00
* f2: 1.00
* f1•f1: 1.00
* f1•f2: 1.00
* f2•f1: 1.00
* f2•f2: 1.00
* **CMP Scenario:**
* f1: 0.71
* f2: 0.62
* f1•f1: 0.65
* f1•f2: 0.68
* f2•f1: 0.32
* f2•f2: 0.16
* **OOD Scenario:**
* f1: 0.00
* f2: 0.00
* f1•f1: 0.46
* f1•f2: 0.35
* f2•f1: 0.40
* f2•f2: 0.35
**Bottom Heatmap (Exact Match %):**
* **ID Scenario:**
* f1: 100
* f2: 100
* f1•f1: 100
* f1•f2: 100
* f2•f1: 100
* f2•f2: 100
* **CMP Scenario:**
* f1: 70
* f2: 60
* f1•f1: 65
* f1•f2: 70
* f2•f1: 30
* f2•f2: 15
* **OOD Scenario:**
* f1: 0
* f2: 0
* f1•f1: 45
* f1•f2: 35
* f2•f1: 40
* f2•f2: 35
### Key Observations
* The ID scenario consistently achieves the highest BLEU scores (1.00) and Exact Match percentages (100%) across all transformations.
* The OOD scenario consistently exhibits the lowest BLEU scores (0.00 for f1 and f2) and Exact Match percentages (0 for f1 and f2).
* The CMP scenario shows intermediate values for both metrics.
* The BLEU score and Exact Match percentage generally decrease as the transformations become more complex (from f1/f2 to f1•f2/f2•f2) within the CMP and OOD scenarios.
* The f2•f1 and f2•f2 transformations consistently yield lower scores than f1•f1 and f1•f2 in the CMP and OOD scenarios.
### Interpretation
The data suggests that the model performs perfectly when the scenario is "In Distribution" (ID), meaning the input data is similar to the training data. However, performance degrades significantly when the scenario is "Out of Distribution" (OOD), indicating the model struggles to generalize to unseen data. The "CMP" scenario represents a middle ground, where the model performs reasonably well but not perfectly.
The transformations (f1, f2, etc.) likely represent different types of data manipulation or augmentation. The decreasing performance with more complex transformations suggests that the model is sensitive to changes in the input data distribution. The difference between f1•f1/f1•f2 and f2•f1/f2•f2 suggests that the order of transformations matters, or that certain transformation combinations are more challenging for the model.
The correlation between BLEU score and Exact Match percentage indicates that these two metrics are measuring similar aspects of model performance. A higher BLEU score generally corresponds to a higher Exact Match percentage, suggesting that the model is producing more accurate and relevant outputs when it performs well. The data highlights the importance of considering out-of-distribution scenarios and the robustness of models to data transformations.