## Line Chart: Accuracy vs. Thinking Compute
### Overview
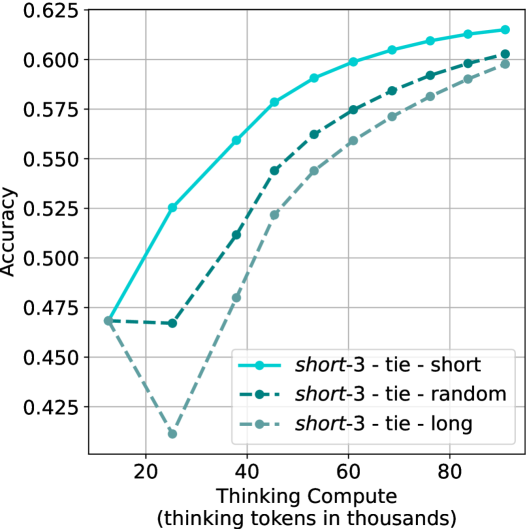
This chart illustrates the relationship between "Thinking Compute" (measured in thousands of thinking tokens) and model "Accuracy" across three different experimental conditions: `short-3 - tie - short`, `short-3 - tie - random`, and `short-3 - tie - long`. The data shows that while all conditions generally improve with increased compute, the "short" condition consistently outperforms the others, while the "long" condition exhibits a significant performance penalty at lower compute levels.
### Components/Axes
* **Y-Axis (Vertical):** Labeled "Accuracy". The scale ranges from 0.425 to 0.625, with major grid lines at intervals of 0.025.
* **X-Axis (Horizontal):** Labeled "Thinking Compute (thinking tokens in thousands)". The scale ranges from 20 to 80, with data points extending from approximately 15 to 91.
* **Legend:** Located in the bottom-right quadrant of the chart.
* `short-3 - tie - short`: Represented by a **solid** bright teal line with circular markers.
* `short-3 - tie - random`: Represented by a **dashed** medium teal line with circular markers.
* `short-3 - tie - long`: Represented by a **dashed** light teal/grey line with circular markers.
### Detailed Analysis
The chart plots 10 data points for each series. The X-axis values appear to be approximately: 15, 25, 38, 45, 53, 61, 68, 76, 84, and 91.
**1. `short-3 - tie - short` (Solid, Bright Teal)**
* **Trend:** This line shows the highest accuracy throughout the entire range. It slopes upward steeply from the start, then gradually flattens as compute increases, indicating diminishing returns.
* **Data Points (Approximate):**
* (15, 0.47)
* (25, 0.525)
* (38, 0.56)
* (45, 0.58)
* (53, 0.59)
* (61, 0.60)
* (68, 0.605)
* (76, 0.61)
* (84, 0.613)
* (91, 0.615)
**2. `short-3 - tie - random` (Dashed, Medium Teal)**
* **Trend:** This line starts at the same point as the others, remains relatively flat between 15k and 25k tokens, then rises steadily. It consistently maintains a middle position between the "short" and "long" conditions.
* **Data Points (Approximate):**
* (15, 0.47)
* (25, 0.468)
* (38, 0.512)
* (45, 0.545)
* (53, 0.563)
* (61, 0.575)
* (68, 0.585)
* (76, 0.593)
* (84, 0.598)
* (91, 0.603)
**3. `short-3 - tie - long` (Dashed, Light Teal/Grey)**
* **Trend:** This line exhibits a sharp, anomalous drop in accuracy at 25k tokens before recovering and trending upward. It remains the lowest-performing series across the entire compute range.
* **Data Points (Approximate):**
* (15, 0.47)
* (25, 0.412)
* (38, 0.48)
* (45, 0.522)
* (53, 0.545)
* (61, 0.56)
* (68, 0.572)
* (76, 0.582)
* (84, 0.59)
* (91, 0.598)
### Key Observations
* **Convergence:** All three series originate from the same point at approximately 15k tokens (Accuracy ~0.47).
* **The "Long" Penalty:** The `short-3 - tie - long` condition suffers a significant performance degradation at 25k tokens, dropping to ~0.412 accuracy. This suggests that forcing "long" thinking ties at low compute budgets is detrimental to model performance.
* **Diminishing Returns:** All three curves flatten significantly after 60k tokens, suggesting that increasing compute beyond this point yields marginal gains in accuracy.
* **Performance Hierarchy:** The hierarchy is consistent: `short` > `random` > `long`.
### Interpretation
This data likely represents an evaluation of Large Language Model (LLM) reasoning capabilities, specifically regarding "thinking" processes or chain-of-thought generation. The "ties" likely refer to different strategies for managing or prompting the model's thinking process.
The data demonstrates that **strategy matters as much as compute**. The "short" strategy is clearly superior, likely because it forces the model to be concise and focused, whereas the "long" strategy may introduce noise or unnecessary complexity that confuses the model at lower compute levels. The fact that all lines converge at the high end (91k tokens) suggests that with enough compute, the model can overcome the inefficiencies of the "long" strategy, but the "short" strategy reaches high accuracy much faster (i.e., with less compute). This is a classic efficiency curve where the "short" strategy is the most resource-efficient path to high accuracy.