## Scatter Plot with Box Plots: Perceived vs. Intended Angles
### Overview
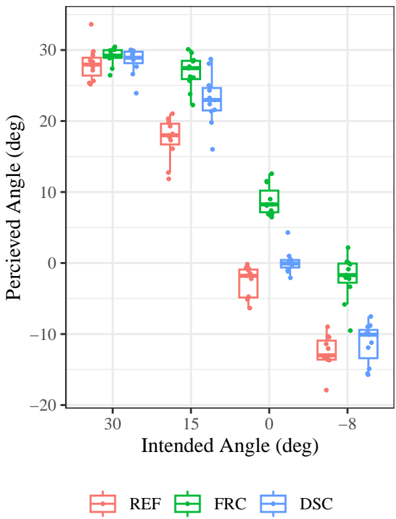
The image is a scatter plot with box plots comparing perceived angles (y-axis) to intended angles (x-axis) across three experimental conditions: REF (red), FRC (green), and DSC (blue). The plot includes grid lines, a legend, and outliers marked as individual points.
---
### Components/Axes
- **X-axis (Intended Angle)**: Labeled "Intended Angle (deg)" with values ranging from -8 to 30 in 15-degree increments.
- **Y-axis (Perceived Angle)**: Labeled "Perceived Angle (deg)" with values from -20 to 30 in 10-degree increments.
- **Legend**: Located at the bottom center, associating colors with conditions:
- Red: REF
- Green: FRC
- Blue: DSC
- **Grid**: Light gray horizontal and vertical lines for reference.
---
### Detailed Analysis
#### REF (Red)
- **Box Plots**: Located at intended angles 30°, 15°, 0°, and -8°.
- **30°**: Median ~25°, IQR ~20–30°.
- **15°**: Median ~15°, IQR ~10–20°.
- **0°**: Median ~-5°, IQR ~-10–0°.
- **-8°**: Median ~-10°, IQR ~-15–-5°.
- **Outliers**: One point at (30°, 35°).
#### FRC (Green)
- **Box Plots**: Located at intended angles 30°, 15°, 0°, and -8°.
- **30°**: Median ~30°, IQR ~25–35°.
- **15°**: Median ~25°, IQR ~20–30°.
- **0°**: Median ~10°, IQR ~5–15°.
- **-8°**: Median ~-5°, IQR ~-10–0°.
- **Outliers**: One point at (-8°, -15°).
#### DSC (Blue)
- **Box Plots**: Located at intended angles 30°, 15°, 0°, and -8°.
- **30°**: Median ~25°, IQR ~20–30°.
- **15°**: Median ~20°, IQR ~15–25°.
- **0°**: Median ~5°, IQR ~0–10°.
- **-8°**: Median ~-10°, IQR ~-15–-5°.
- **Outliers**: One point at (0°, 5°).
---
### Key Observations
1. **Downward Trend**: All three conditions show a consistent decrease in perceived angle as intended angle decreases.
2. **REF vs. FRC vs. DSC**:
- REF has the highest medians across all intended angles.
- FRC has the second-highest medians, with a slight divergence at -8°.
- DSC has the lowest medians, particularly at -8°.
3. **Outliers**:
- REF’s outlier at (30°, 35°) exceeds the upper whisker.
- FRC’s outlier at (-8°, -15°) falls below the lower whisker.
- DSC’s outlier at (0°, 5°) is within the IQR but slightly above the median.
---
### Interpretation
The data suggests that perceived angles systematically decrease as intended angles decrease across all conditions. However, the magnitude of this effect varies:
- **REF** consistently overestimates perceived angles compared to FRC and DSC, possibly indicating a calibration bias or perceptual distortion in this condition.
- **FRC** shows the most variability, with a notable outlier at -8°, suggesting potential measurement noise or anomalous responses.
- **DSC** demonstrates the smallest perceived angles, which may reflect a more accurate or constrained perceptual mechanism.
The trends align with the hypothesis that perception is influenced by the intended angle, but the differences between conditions highlight how experimental variables (e.g., REF, FRC, DSC) modulate this relationship. Outliers warrant further investigation to determine if they represent errors or meaningful deviations.