\n
## Histogram: Density of Consistency Score with Correct/Incorrect Answers
### Overview
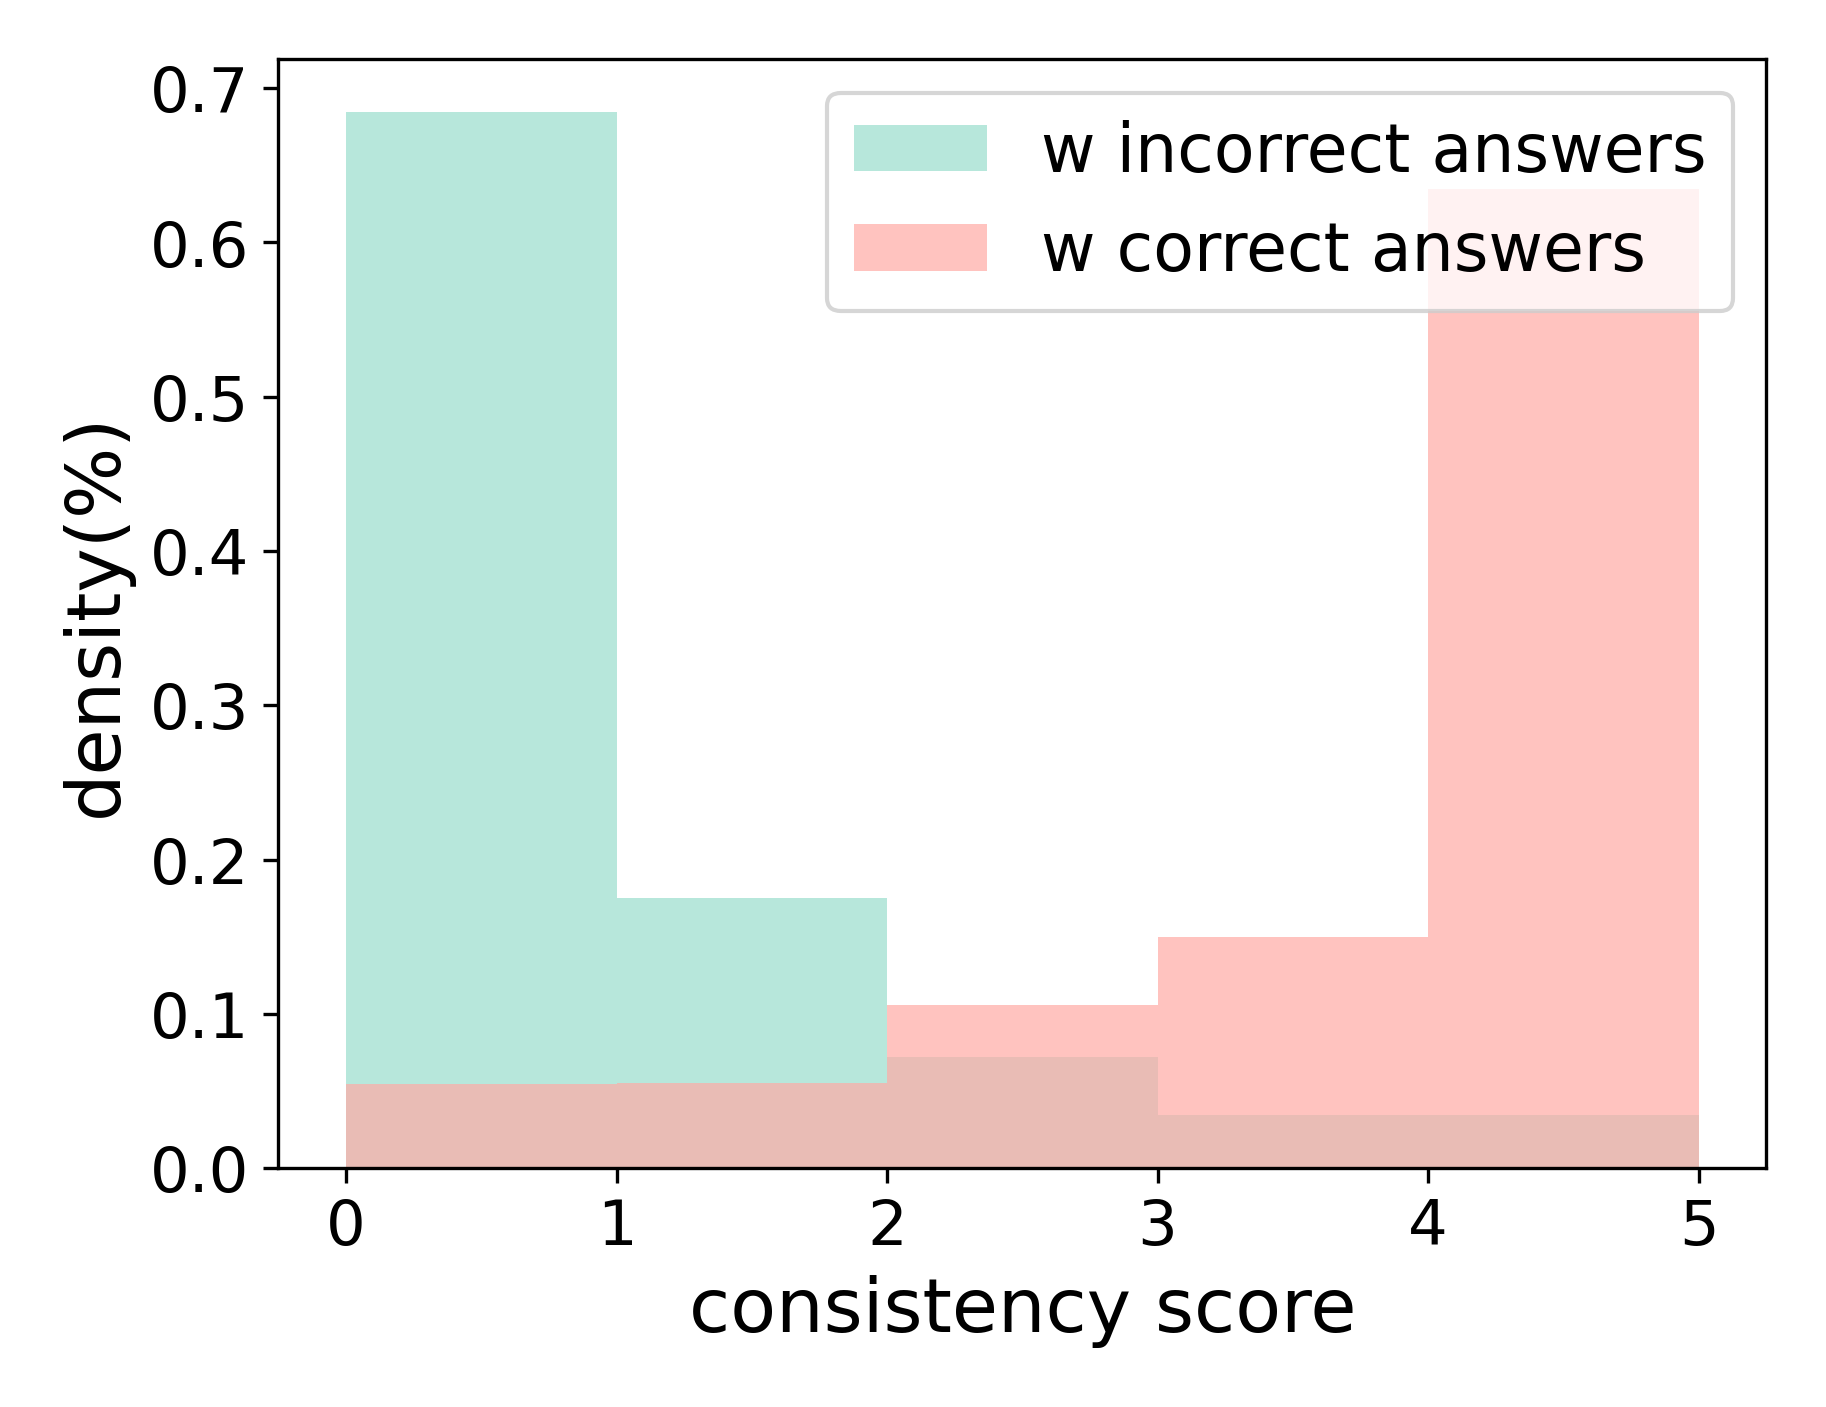
The image presents a histogram comparing the density distribution of "consistency score" for two groups: those with "incorrect answers" and those with "correct answers". The x-axis represents the consistency score, and the y-axis represents the density (expressed as a percentage).
### Components/Axes
* **X-axis Title:** "consistency score"
* **X-axis Range:** 0 to 5
* **Y-axis Title:** "density (%)"
* **Y-axis Range:** 0 to 0.7
* **Legend:** Located in the top-right corner.
* "w incorrect answers" - represented by a light green color.
* "w correct answers" - represented by a light red color.
### Detailed Analysis
The histogram displays the distribution of consistency scores for each group.
**Incorrect Answers (Light Green):**
The distribution is heavily skewed towards lower consistency scores.
* Around a consistency score of 0, the density is approximately 0.68.
* The density decreases rapidly as the consistency score increases.
* Between consistency scores of 0 and 1, the density remains high, around 0.65-0.7.
* At a consistency score of 1, the density is approximately 0.65.
* At a consistency score of 2, the density drops to approximately 0.15.
* The density remains low for consistency scores greater than 2, fluctuating around 0.05-0.1.
**Correct Answers (Light Red):**
The distribution is skewed towards higher consistency scores.
* Around a consistency score of 5, the density is approximately 0.55.
* The density is relatively low for consistency scores below 3.
* At a consistency score of 0, the density is approximately 0.02.
* At a consistency score of 1, the density is approximately 0.03.
* At a consistency score of 2, the density is approximately 0.05.
* At a consistency score of 3, the density increases to approximately 0.12.
* At a consistency score of 4, the density increases to approximately 0.18.
* At a consistency score of 5, the density reaches approximately 0.55.
### Key Observations
* The distribution of consistency scores is significantly different for incorrect and correct answers.
* Incorrect answers tend to have lower consistency scores, while correct answers tend to have higher consistency scores.
* There is a clear separation between the two distributions, suggesting that consistency score is a useful indicator of answer correctness.
* The peak density for incorrect answers is around 0, while the peak density for correct answers is around 5.
### Interpretation
The data suggests a strong correlation between consistency score and answer correctness. Higher consistency scores are associated with correct answers, and lower consistency scores are associated with incorrect answers. This implies that the "consistency score" metric effectively measures the reliability or coherence of the reasoning process leading to an answer.
The stark difference in distributions indicates that the consistency score can be used as a predictor of answer accuracy. A model or system could potentially use this score to identify and flag potentially incorrect answers for review. The fact that the distributions are not entirely separated suggests that consistency score is not a perfect predictor, and some incorrect answers may still have relatively high consistency scores, and vice versa. Further investigation might be needed to understand the reasons for these outliers. The distributions are not normal, but rather heavily skewed, which suggests that the consistency score may be bounded or influenced by other factors.