## Bar Chart: Consistency Score Density Comparison
### Overview
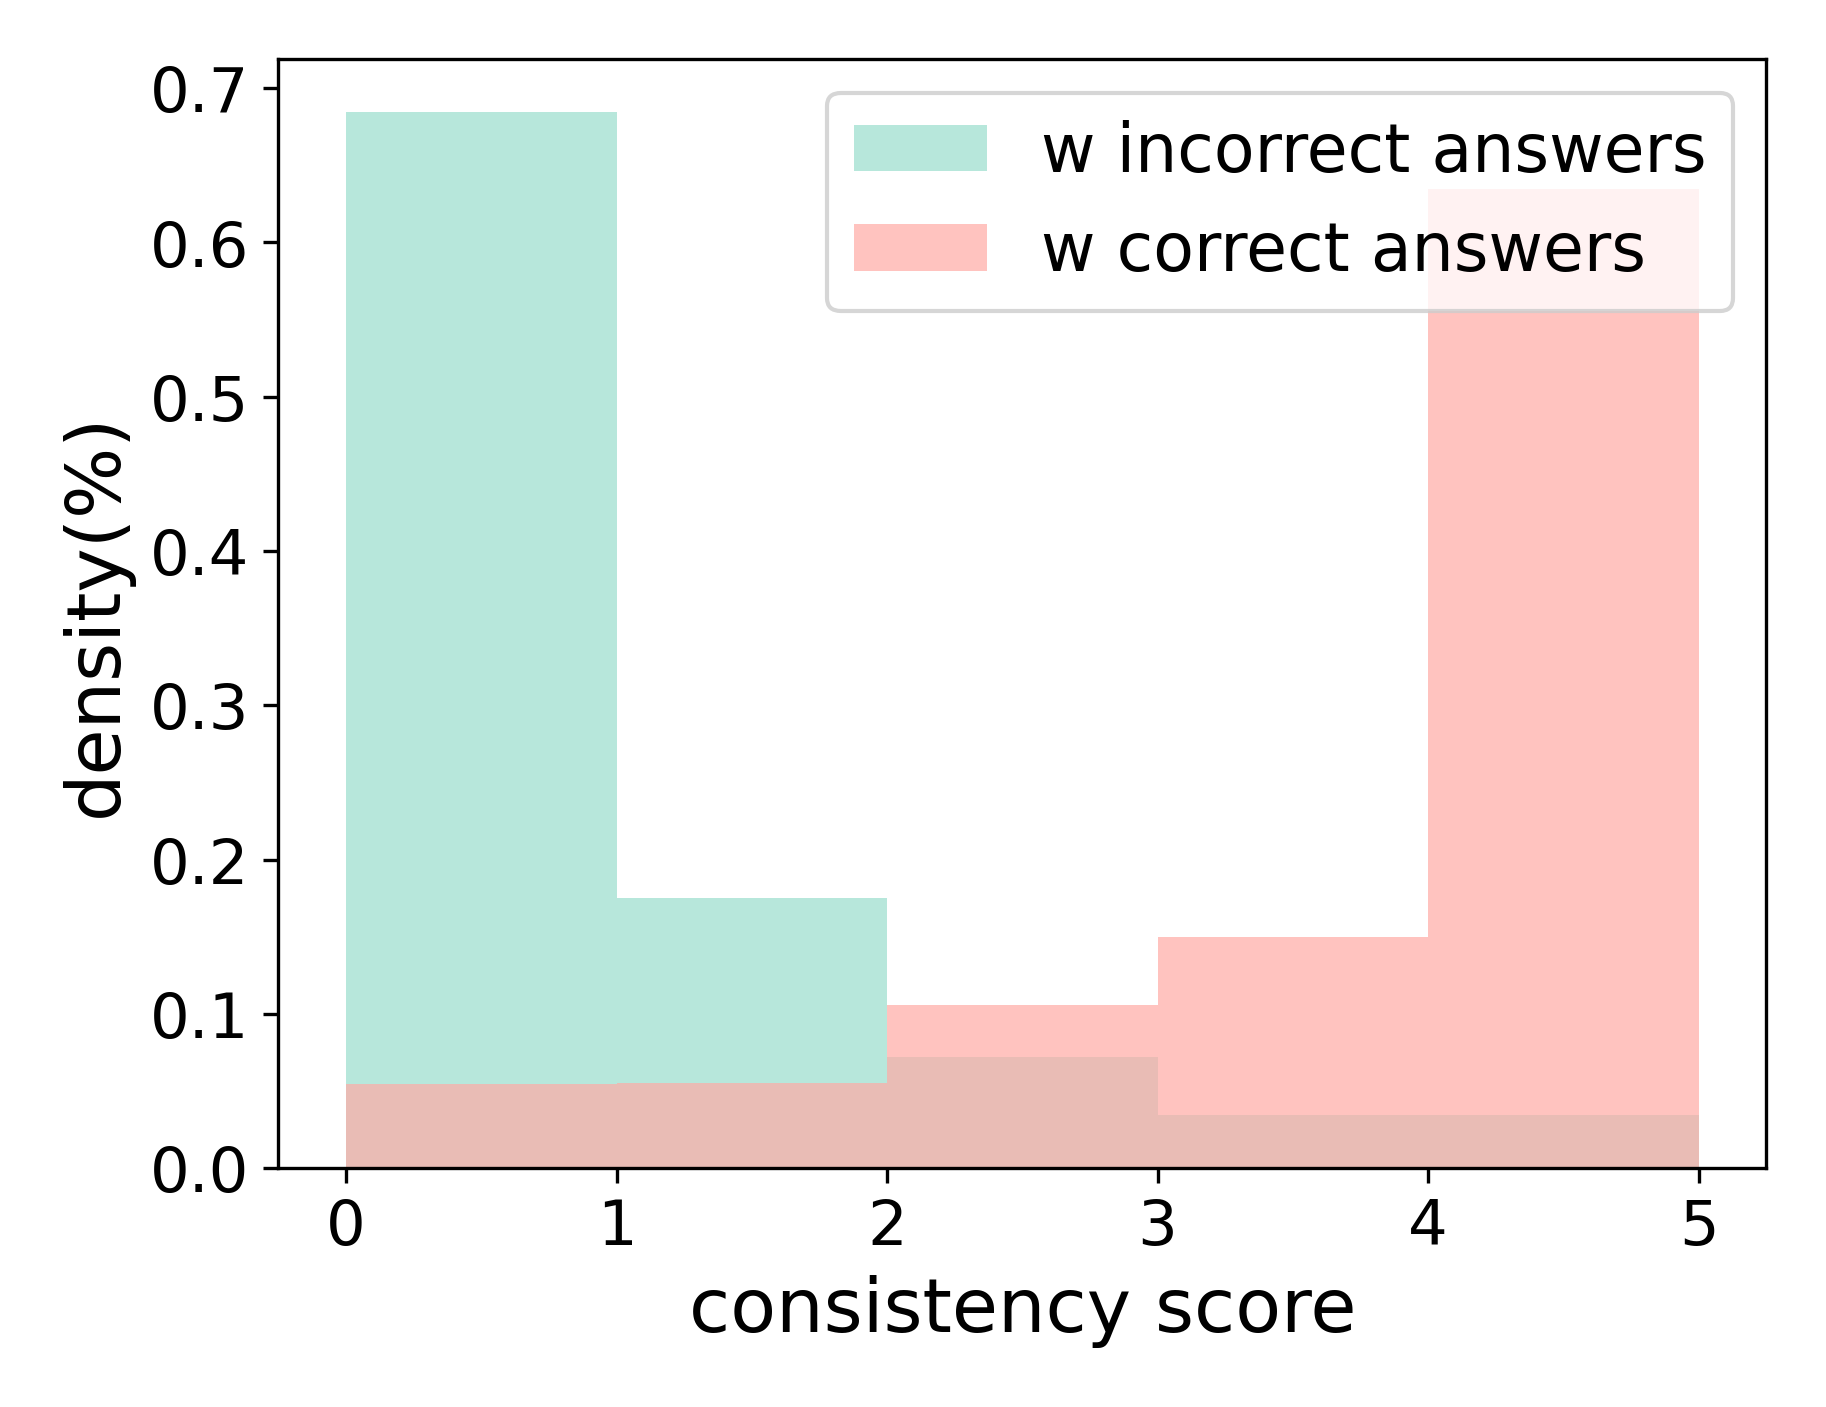
The chart compares the density distribution of consistency scores for two groups: "w incorrect answers" (green) and "w correct answers" (pink). The x-axis represents consistency scores (0-5), while the y-axis shows density percentages (0-0.7). The data reveals distinct patterns in score distributions between the two groups.
### Components/Axes
- **X-axis**: "consistency score" (integer values 0-5)
- **Y-axis**: "density(%)" (continuous scale 0-0.7)
- **Legend**:
- Green: "w incorrect answers"
- Pink: "w correct answers"
- **Bar Placement**:
- Green bars dominate left side (scores 0-2)
- Pink bars dominate right side (scores 4-5)
- Minimal overlap in middle scores (2-3)
### Detailed Analysis
1. **w incorrect answers (Green)**:
- Score 0: ~0.7 density
- Score 1: ~0.2 density
- Score 2: ~0.1 density
- Scores 3-5: <0.05 density
- *Trend*: Sharp decline from score 0 to 2, negligible presence at higher scores
2. **w correct answers (Pink)**:
- Score 0: ~0.05 density
- Score 1: ~0.05 density
- Score 2: ~0.1 density
- Score 3: ~0.15 density
- Score 4: ~0.4 density
- Score 5: ~0.6 density
- *Trend*: Gradual increase from score 2 to 5, with steep rise at scores 4-5
### Key Observations
- **Inverse Relationship**: Higher consistency scores correlate strongly with correct answers (pink bars peak at 5.0), while incorrect answers cluster at lower scores (green bars peak at 0.0).
- **Middle Score Gap**: Both groups show minimal density between scores 2-3, suggesting a potential threshold effect.
- **Density Extremes**:
- Maximum green density: 0.7 at score 0
- Maximum pink density: 0.6 at score 5
### Interpretation
The data demonstrates a clear dichotomy in consistency scores based on answer correctness. Correct answers consistently yield higher scores (median ~4.5), while incorrect answers cluster at the lowest scores (median ~0.5). The absence of intermediate scores for both groups suggests a binary outcome structure, possibly indicating a pass/fail or correct/incorrect dichotomy in the underlying assessment. This pattern implies that answer accuracy directly determines consistency in responses, with no meaningful middle ground observed in the distribution.