\n
## Scatter Plot: Tourism Index vs. Monthly Indicator
### Overview
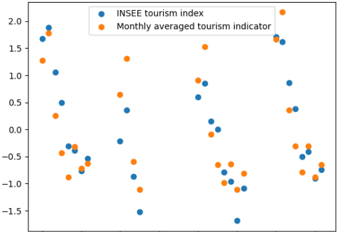
The image presents a scatter plot comparing two tourism-related indicators over an unspecified time period. The plot displays the relationship between the INSEE tourism index and the monthly averaged tourism indicator. The x-axis represents the time dimension, while the y-axis represents the index/indicator values.
### Components/Axes
* **X-axis:** Unlabeled, presumably representing time (months or similar).
* **Y-axis:** Ranges from approximately -1.5 to 2.0, with markings at -1.5, -1.0, -0.5, 0.0, 0.5, 1.0, 1.5, and 2.0.
* **Legend:** Located in the top-right corner.
* **INSEE tourism index:** Represented by blue circles.
* **Monthly averaged tourism indicator:** Represented by orange circles.
### Detailed Analysis
The plot contains a series of data points for each indicator.
**INSEE Tourism Index (Blue Circles):**
The blue data points exhibit a generally fluctuating pattern.
* Starting from the left, the first few points are around y = 1.7 to 1.9.
* There's a dip to approximately y = 1.2.
* The values then fluctuate between approximately y = 0.8 and -0.4.
* Towards the right side of the plot, the values range from approximately y = -1.2 to y = 1.0.
* The last few points are around y = 1.8 to 0.8.
**Monthly Averaged Tourism Indicator (Orange Circles):**
The orange data points also show fluctuations.
* Starting from the left, the first few points are around y = 1.6 to 1.8.
* The values then decrease to approximately y = 0.5.
* The values fluctuate between approximately y = 0.5 and -1.3.
* Towards the right side of the plot, the values range from approximately y = -1.0 to y = 0.5.
* The last few points are around y = 0.4 to 0.0.
There is no clear linear correlation between the two indicators. The points are scattered, suggesting a complex or weak relationship.
### Key Observations
* Both indicators exhibit similar fluctuations over time, but their magnitudes and timing differ.
* There are periods where both indicators are positive, and periods where both are negative.
* There are no obvious outliers.
* The data does not show a consistent lead or lag between the two indicators.
### Interpretation
The scatter plot suggests that the INSEE tourism index and the monthly averaged tourism indicator are related, but not perfectly correlated. Both indicators likely respond to similar underlying factors (e.g., seasonality, economic conditions, global events), but they may capture different aspects of tourism activity or be calculated using different methodologies. The fluctuations in both indicators could be due to seasonal variations, unexpected events, or changes in tourism trends.
The lack of a strong correlation suggests that neither indicator can be used to perfectly predict the other. However, analyzing both indicators together may provide a more comprehensive understanding of tourism trends than relying on either one alone. Further investigation would be needed to determine the specific factors driving the observed patterns and to assess the statistical significance of any observed relationships.