## Heatmap: CMO-HfOₓ ReRAM during programming
### Overview
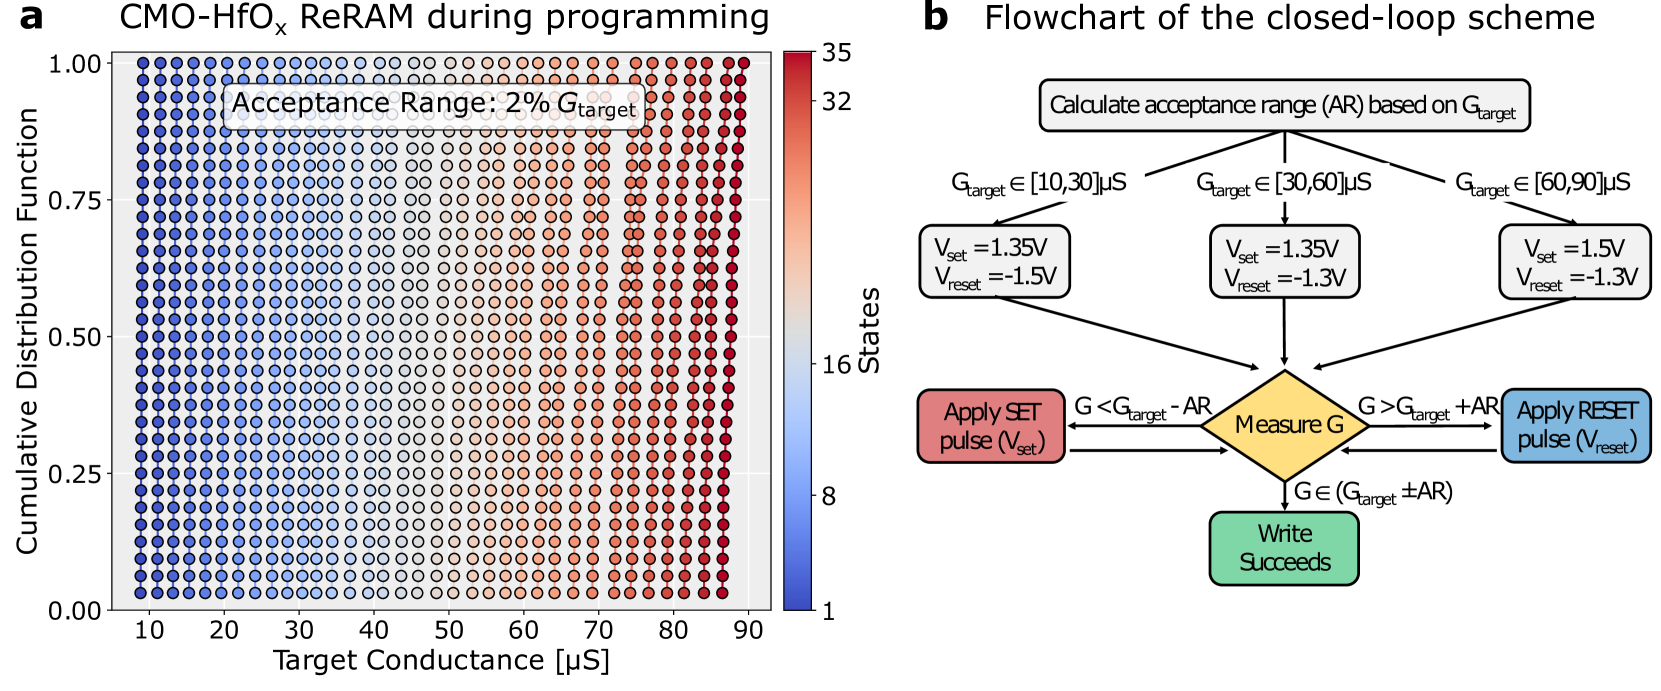
A heatmap visualizing the relationship between target conductance (μS) and cumulative distribution function (CDF) during ReRAM programming. Color intensity represents the number of states achieved, with a focus on an "Acceptance Range: 2% G_target".
### Components/Axes
- **X-axis**: Target Conductance [μS] (10–90 μS, linear scale).
- **Y-axis**: Cumulative Distribution Function (0.00–1.00, linear scale).
- **Color Scale**: States (1–35, gradient from blue to red).
- **Legend**: Located on the right; blue = low states, red = high states.
- **Text Box**: "Acceptance Range: 2% G_target" in the top-left.
### Detailed Analysis
- **Color Gradient**:
- Blue (low states) dominates the left (10–30 μS).
- Red (high states) dominates the right (70–90 μS).
- Intermediate values (30–70 μS) show a gradient from light blue to orange.
- **Acceptance Range**:
- Defined as ±2% of G_target (e.g., for G_target = 50 μS, AR = ±1 μS).
- Highlighted by the text box and implied by the heatmap’s color transitions.
### Key Observations
- **Trend**: Higher target conductances correlate with higher state values (red regions).
- **Outlier**: No explicit outliers; uniformity in color distribution within ranges.
### Interpretation
The heatmap demonstrates that ReRAM programming success (measured by state count) increases with target conductance. The 2% acceptance range ensures minimal variability in conductance targeting, critical for reliable memory operation.
---
## Diagram: Flowchart of the closed-loop scheme
### Overview
A flowchart detailing the adaptive programming process for ReRAM, including voltage selection, conductance measurement, and feedback loops.
### Components/Axes
- **Decision Diamond**: "Measure G" with conditions:
- G < G_target - AR → Apply SET pulse (V_set).
- G > G_target + AR → Apply RESET pulse (V_reset).
- **Voltage Boxes**:
- **SET**: V_set = 1.35V (G_target ∈ [10,30] μS), V_reset = -1.5V.
- **RESET**: V_set = 1.5V (G_target ∈ [60,90] μS), V_reset = -1.3V.
- **Flow Direction**: Top-to-bottom, with arrows indicating process steps.
### Content Details
1. **Calculate acceptance range (AR) based on G_target**:
- G_target ∈ [10,30] μS → AR = ±2% of G_target.
- G_target ∈ [30,60] μS → AR = ±2% of G_target.
- G_target ∈ [60,90] μS → AR = ±2% of G_target.
2. **Apply SET/RESET pulses**:
- SET: V_set = 1.35V (low G_target), V_reset = -1.5V.
- RESET: V_set = 1.5V (high G_target), V_reset = -1.3V.
3. **Write Success**: Achieved when G ∈ (G_target ± AR).
### Key Observations
- **Conditional Logic**: Voltage selection depends on G_target’s range and measured conductance.
- **Feedback Loop**: Continuous adjustment ensures G stays within the target ± AR.
### Interpretation
The flowchart outlines an adaptive programming strategy where voltage pulses are dynamically adjusted based on real-time conductance measurements. This ensures precise targeting of G_target within a tight tolerance (2% AR), critical for stable ReRAM operation. The use of opposing voltages (SET/RESET) highlights the bidirectional control required for memory switching.