\n
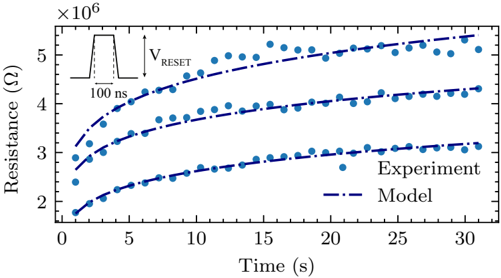
## Chart: Resistance vs. Time
### Overview
The image presents a chart illustrating the relationship between resistance (in Ohms, Ω) and time (in seconds, s). Two data series are displayed: experimental data represented by solid blue circles, and a model prediction represented by dashed blue lines. A small inset diagram in the top-left corner depicts a pulse waveform with a labeled reset voltage (V<sub>RESET</sub>) and pulse duration (100 ns).
### Components/Axes
* **X-axis:** Time (s), ranging from 0 to 30 seconds.
* **Y-axis:** Resistance (Ω), ranging from approximately 1.5 x 10<sup>6</sup> to 5.5 x 10<sup>6</sup> Ohms. The scale is explicitly shown as "x 10<sup>6</sup>".
* **Data Series 1:** "Experiment" - Represented by solid blue circles.
* **Data Series 2:** "Model" - Represented by dashed blue lines.
* **Legend:** Located in the bottom-right corner, labeling the two data series.
* **Inset Diagram:** A pulse waveform in the top-left corner, labeled with "V<sub>RESET</sub>" and "100 ns".
### Detailed Analysis
The chart displays the change in resistance over time for both the experimental data and the model.
**Experiment Data (Solid Blue Circles):**
The experimental data shows an increasing resistance over time.
* At t = 0 s, Resistance ≈ 1.8 x 10<sup>6</sup> Ω.
* At t = 5 s, Resistance ≈ 3.2 x 10<sup>6</sup> Ω.
* At t = 10 s, Resistance ≈ 4.2 x 10<sup>6</sup> Ω.
* At t = 15 s, Resistance ≈ 4.6 x 10<sup>6</sup> Ω.
* At t = 20 s, Resistance ≈ 4.8 x 10<sup>6</sup> Ω.
* At t = 25 s, Resistance ≈ 4.9 x 10<sup>6</sup> Ω.
* At t = 30 s, Resistance ≈ 5.1 x 10<sup>6</sup> Ω.
**Model Data (Dashed Blue Lines):**
The model data also shows an increasing resistance over time, but with a steeper initial increase and a slower rate of increase as time progresses. There are three dashed lines, representing three different model predictions.
* **Top Model Line:**
* At t = 0 s, Resistance ≈ 2.2 x 10<sup>6</sup> Ω.
* At t = 5 s, Resistance ≈ 3.8 x 10<sup>6</sup> Ω.
* At t = 10 s, Resistance ≈ 4.7 x 10<sup>6</sup> Ω.
* At t = 15 s, Resistance ≈ 5.0 x 10<sup>6</sup> Ω.
* At t = 20 s, Resistance ≈ 5.2 x 10<sup>6</sup> Ω.
* At t = 25 s, Resistance ≈ 5.3 x 10<sup>6</sup> Ω.
* At t = 30 s, Resistance ≈ 5.4 x 10<sup>6</sup> Ω.
* **Middle Model Line:**
* At t = 0 s, Resistance ≈ 2.0 x 10<sup>6</sup> Ω.
* At t = 5 s, Resistance ≈ 3.5 x 10<sup>6</sup> Ω.
* At t = 10 s, Resistance ≈ 4.4 x 10<sup>6</sup> Ω.
* At t = 15 s, Resistance ≈ 4.7 x 10<sup>6</sup> Ω.
* At t = 20 s, Resistance ≈ 4.9 x 10<sup>6</sup> Ω.
* At t = 25 s, Resistance ≈ 5.0 x 10<sup>6</sup> Ω.
* At t = 30 s, Resistance ≈ 5.1 x 10<sup>6</sup> Ω.
* **Bottom Model Line:**
* At t = 0 s, Resistance ≈ 1.8 x 10<sup>6</sup> Ω.
* At t = 5 s, Resistance ≈ 3.2 x 10<sup>6</sup> Ω.
* At t = 10 s, Resistance ≈ 4.1 x 10<sup>6</sup> Ω.
* At t = 15 s, Resistance ≈ 4.4 x 10<sup>6</sup> Ω.
* At t = 20 s, Resistance ≈ 4.6 x 10<sup>6</sup> Ω.
* At t = 25 s, Resistance ≈ 4.7 x 10<sup>6</sup> Ω.
* At t = 30 s, Resistance ≈ 4.8 x 10<sup>6</sup> Ω.
**Inset Diagram:**
The inset diagram shows a rectangular pulse with a sharp rise and fall time. The pulse duration is labeled as "100 ns". The reset voltage is labeled as "V<sub>RESET</sub>".
### Key Observations
* The experimental data and the model data both show an increasing resistance over time, indicating a change in the material's properties.
* The model predictions diverge, suggesting different parameter settings or assumptions within the model.
* The experimental data generally falls between the lower and middle model predictions.
* The initial rate of resistance increase is higher for the model predictions than for the experimental data.
### Interpretation
The chart demonstrates the relationship between time and resistance, likely in a material undergoing a change in state (e.g., a phase change memory). The model attempts to predict the experimental behavior, and the comparison reveals the model's accuracy and limitations. The inset diagram suggests that a reset pulse (V<sub>RESET</sub>) is applied to the material, potentially triggering the observed resistance change. The divergence in model predictions indicates sensitivity to model parameters. The fact that the experimental data falls between the model predictions suggests that the model is reasonably accurate, but may require further refinement to capture the nuances of the experimental behavior. The slower initial increase in experimental resistance compared to the model could indicate a delay in the material's response to the reset pulse or a difference in the material's properties compared to the model's assumptions.