## Heatmap: Model Coverage Comparison
### Overview
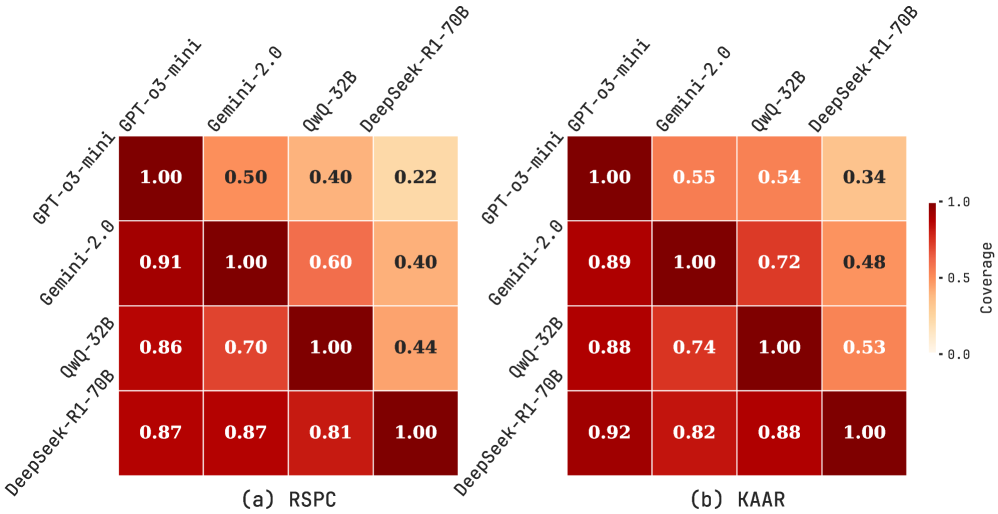
The image presents two heatmaps comparing the coverage of different language models (GPT-03-mini, Gemini-2.0, QwQ-32B, and DeepSeek-R1-70B) on two datasets: RSPC (left) and KAAR (right). The heatmaps visualize the pairwise coverage between these models, with darker shades indicating higher coverage. A color bar on the right indicates the coverage scale, ranging from 0.0 to 1.0.
### Components/Axes
* **Models (Rows/Columns):** GPT-03-mini, Gemini-2.0, QwQ-32B, DeepSeek-R1-70B. These models are listed on both the x and y axes of each heatmap.
* **Heatmap Cells:** Each cell represents the coverage score between two models.
* **Color Scale:** A vertical color bar on the right side of the image indicates the coverage values, ranging from 0.0 (lightest) to 1.0 (darkest).
* **Titles:** (a) RSPC, (b) KAAR
* **Coverage Scale:** The color bar is labeled "Coverage" and ranges from 0.0 to 1.0, with a tick mark at 0.5.
### Detailed Analysis
**Heatmap (a) RSPC:**
| Model 1 | Model 2 | Coverage |
| -------------- | -------------- | -------- |
| GPT-03-mini | GPT-03-mini | 1.00 |
| GPT-03-mini | Gemini-2.0 | 0.50 |
| GPT-03-mini | QwQ-32B | 0.40 |
| GPT-03-mini | DeepSeek-R1-70B | 0.22 |
| Gemini-2.0 | GPT-03-mini | 0.91 |
| Gemini-2.0 | Gemini-2.0 | 1.00 |
| Gemini-2.0 | QwQ-32B | 0.60 |
| Gemini-2.0 | DeepSeek-R1-70B | 0.40 |
| QwQ-32B | GPT-03-mini | 0.86 |
| QwQ-32B | Gemini-2.0 | 0.70 |
| QwQ-32B | QwQ-32B | 1.00 |
| QwQ-32B | DeepSeek-R1-70B | 0.44 |
| DeepSeek-R1-70B | GPT-03-mini | 0.87 |
| DeepSeek-R1-70B | Gemini-2.0 | 0.87 |
| DeepSeek-R1-70B | QwQ-32B | 0.81 |
| DeepSeek-R1-70B | DeepSeek-R1-70B | 1.00 |
**Heatmap (b) KAAR:**
| Model 1 | Model 2 | Coverage |
| -------------- | -------------- | -------- |
| GPT-03-mini | GPT-03-mini | 1.00 |
| GPT-03-mini | Gemini-2.0 | 0.55 |
| GPT-03-mini | QwQ-32B | 0.54 |
| GPT-03-mini | DeepSeek-R1-70B | 0.34 |
| Gemini-2.0 | GPT-03-mini | 0.89 |
| Gemini-2.0 | Gemini-2.0 | 1.00 |
| Gemini-2.0 | QwQ-32B | 0.72 |
| Gemini-2.0 | DeepSeek-R1-70B | 0.48 |
| QwQ-32B | GPT-03-mini | 0.88 |
| QwQ-32B | Gemini-2.0 | 0.74 |
| QwQ-32B | QwQ-32B | 1.00 |
| QwQ-32B | DeepSeek-R1-70B | 0.53 |
| DeepSeek-R1-70B | GPT-03-mini | 0.92 |
| DeepSeek-R1-70B | Gemini-2.0 | 0.82 |
| DeepSeek-R1-70B | QwQ-32B | 0.88 |
| DeepSeek-R1-70B | DeepSeek-R1-70B | 1.00 |
### Key Observations
* **Diagonal Values:** All diagonal values are 1.00, indicating that each model has perfect coverage with itself.
* **RSPC vs. KAAR:** The coverage scores generally appear higher in the KAAR dataset compared to the RSPC dataset.
* **GPT-03-mini Coverage:** GPT-03-mini tends to have lower coverage when compared to other models, especially with DeepSeek-R1-70B.
* **DeepSeek-R1-70B Coverage:** DeepSeek-R1-70B shows relatively high coverage with other models.
### Interpretation
The heatmaps provide a visual comparison of the coverage between different language models on two datasets. The higher coverage scores on the KAAR dataset suggest that the models may perform better or have a more comprehensive understanding of the KAAR dataset compared to the RSPC dataset. The lower coverage of GPT-03-mini with other models, particularly DeepSeek-R1-70B, indicates potential differences in their understanding or approach to the tasks represented by these datasets. The high self-coverage (diagonal values of 1.00) is expected and serves as a baseline for comparison. The differences in coverage between models and datasets could be attributed to factors such as model architecture, training data, or the specific characteristics of the datasets themselves.