\n
## Line Charts: Model Performance Comparison (Two Metrics)
### Overview
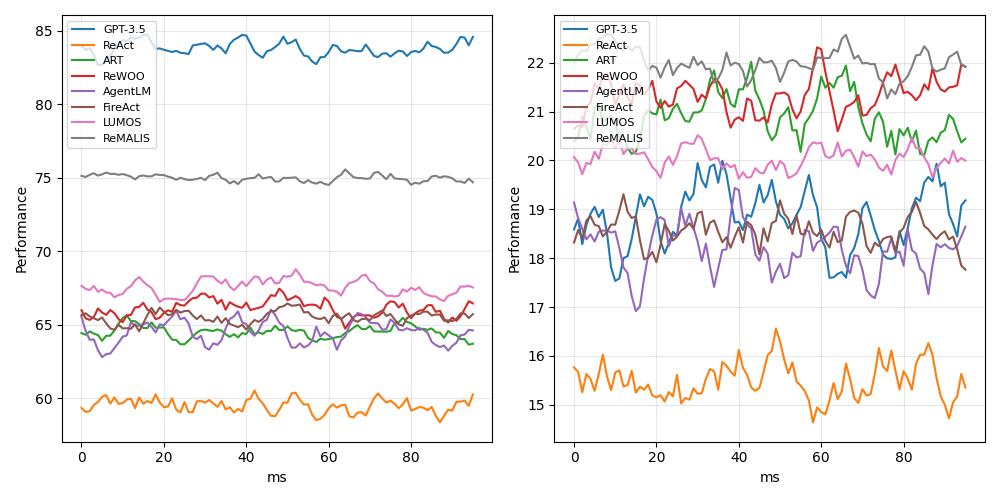
The image displays two side-by-side line charts comparing the performance of eight different AI models or methods over time (measured in milliseconds). The charts share the same legend and x-axis but have different y-axis scales, suggesting they measure two distinct performance metrics. The data appears noisy, with frequent fluctuations for all series.
### Components/Axes
* **Chart Layout:** Two distinct line charts arranged horizontally.
* **Legend:** Located in the top-left corner of each chart. Contains eight entries with corresponding line colors:
* GPT-3.5 (Blue)
* ReAct (Orange)
* ART (Green)
* ReWOO (Red)
* AgentLM (Purple)
* FireAct (Brown)
* LLMOS (Pink)
* ReMALIS (Gray)
* **X-Axis (Both Charts):**
* **Label:** `ms` (milliseconds)
* **Scale:** Linear, from 0 to approximately 95.
* **Major Ticks:** 0, 20, 40, 60, 80.
* **Y-Axis (Left Chart):**
* **Label:** `Performance`
* **Scale:** Linear, from 60 to 85.
* **Major Ticks:** 60, 65, 70, 75, 80, 85.
* **Y-Axis (Right Chart):**
* **Label:** `Performance`
* **Scale:** Linear, from 15 to 22.
* **Major Ticks:** 15, 16, 17, 18, 19, 20, 21, 22.
### Detailed Analysis
**Left Chart (Performance Range ~60-85):**
* **Trend Verification & Data Points (Approximate Ranges):**
* **GPT-3.5 (Blue):** Consistently the highest. Trends slightly upward from ~83 to ~85. Range: ~82-85.
* **ReMALIS (Gray):** Second highest, very stable. Hovers around 75. Range: ~74-76.
* **LLMOS (Pink):** Third highest, moderate fluctuation. Range: ~67-69.
* **ReWOO (Red):** Fluctuates in the middle of the pack. Range: ~65-68.
* **FireAct (Brown):** Similar range to ReWOO, often intertwined. Range: ~64-67.
* **ART (Green):** Lower-middle range. Range: ~63-66.
* **AgentLM (Purple):** Lower-middle range, often the lowest in this cluster. Range: ~62-65.
* **ReAct (Orange):** Consistently the lowest by a significant margin. Range: ~58-61.
**Right Chart (Performance Range ~15-22):**
* **Trend Verification & Data Points (Approximate Ranges):**
* **ReMALIS (Gray):** Consistently the highest. Shows high volatility. Range: ~21-22.5.
* **ReWOO (Red):** Second highest, also volatile. Range: ~20.5-22.
* **ART (Green):** Third highest, volatile. Range: ~20-21.5.
* **LLMOS (Pink):** Middle range, less volatile than the top three. Range: ~19.5-20.5.
* **GPT-3.5 (Blue):** Middle range, highly volatile. Range: ~17.5-20.
* **FireAct (Brown):** Middle range, volatile. Range: ~18-19.5.
* **AgentLM (Purple):** Lower-middle range, volatile. Range: ~17-19.
* **ReAct (Orange):** Consistently the lowest, with notable dips. Range: ~14.5-16.5.
### Key Observations
1. **Performance Inversion:** The ranking of models is drastically different between the two metrics. GPT-3.5, which leads the left chart, is in the middle of the pack on the right chart. Conversely, ReMALIS is a top performer on both charts but leads the right chart.
2. **Volatility Contrast:** The data in the right chart (lower performance scale) exhibits significantly higher volatility (larger, more frequent swings) for all models compared to the relatively smoother lines in the left chart.
3. **Consistent Outlier:** ReAct is the lowest-performing model on both metrics by a clear margin.
4. **Clustering:** On the left chart, six of the eight models (excluding GPT-3.5 and ReMALIS) form a tight cluster between 62-69. On the right chart, the models are more spread out across the 15-22 range.
### Interpretation
The two charts likely represent two different evaluation metrics for the same set of AI agent frameworks or reasoning methods. The left chart's higher scale (60-85) suggests a metric like **accuracy, success rate, or a normalized score**, where GPT-3.5 (a base model) performs best, and specialized methods like ReMALIS are competitive. The right chart's lower, more volatile scale (15-22) could represent a metric like **efficiency, speed (inverse latency), or a cost-sensitive score**, where specialized methods (ReMALIS, ReWOO, ART) outperform the base GPT-3.5, but with less stability.
The stark difference in rankings implies a **trade-off** between the two measured qualities. A model excelling in raw performance (left chart) may not be the most efficient or cost-effective (right chart). The high volatility in the right chart suggests that the efficiency metric is more sensitive to run-to-run variation or specific task conditions. ReAct's consistently poor performance on both metrics indicates it may be a less effective approach for the tasks evaluated here. The analysis suggests that model selection should be guided by which metric (performance vs. efficiency) is prioritized for the specific application.