## Grid Visualization: Pixel Density vs. Delta Values
### Overview
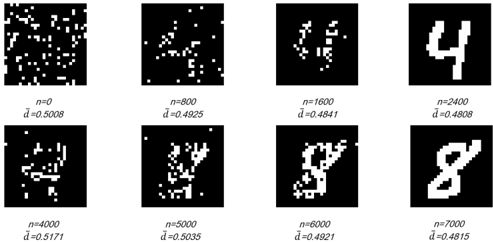
The image displays eight black-and-white grids arranged in a 2x4 matrix. Each grid represents a different pixel density (n) with corresponding delta values (d̄). The grids transition from sparse to dense pixel distributions, with numerical labels indicating the number of pixels (n) and calculated delta values (d̄) beneath each grid.
### Components/Axes
- **Grid Layout**: Two rows of four grids each.
- **Labels**: Each grid has a label below it specifying:
- **n**: Number of pixels (e.g., "n=0", "n=800", ..., "n=7000").
- **d̄**: Delta value (e.g., "d̄=0.5008", "d̄=0.4925", ..., "d̄=0.4815").
- **No Axes/Legends**: The image lacks explicit axes, scales, or legends beyond the grid labels.
### Detailed Analysis
1. **Top Row (n=0 to n=2400)**:
- **n=0**: Empty grid, d̄=0.5008.
- **n=800**: Sparse pixel distribution, d̄=0.4925.
- **n=1600**: Moderate density, d̄=0.4841.
- **n=2400**: Dense but fragmented, d̄=0.4808.
2. **Bottom Row (n=4000 to n=7000)**:
- **n=4000**: High density with gaps, d̄=0.5171 (outlier).
- **n=5000**: More cohesive, d̄=0.5035.
- **n=6000**: Near-complete coverage, d̄=0.4921.
- **n=7000**: Fully formed digit "8", d̄=0.4815.
### Key Observations
- **General Trend**: Delta values (d̄) decrease as pixel count (n) increases, suggesting improved efficiency or stability with higher densities.
- **Outlier**: The grid at n=4000 has a higher d̄ (0.5171) than its neighbors, indicating a potential anomaly or inefficiency at this density.
- **Digit Formation**: The final grid (n=7000) clearly represents the digit "8", while earlier grids show progressive formation of this shape.
### Interpretation
The data suggests a relationship between pixel density and a metric (d̄) that improves (decreases) as more pixels are added. The outlier at n=4000 may reflect a transitional phase where increased density introduces complexity before stabilizing. The formation of the digit "8" at n=7000 implies the grids represent stages in rendering or reconstructing a specific pattern, with d̄ possibly measuring reconstruction accuracy or computational efficiency. The initial high d̄ at n=0 (0.5008) and gradual decline to 0.4815 at n=7000 highlight a systematic improvement in the underlying process as data complexity increases.