## Line Charts: Llama-3.2-1B and Llama-3.2-3B Performance
### Overview
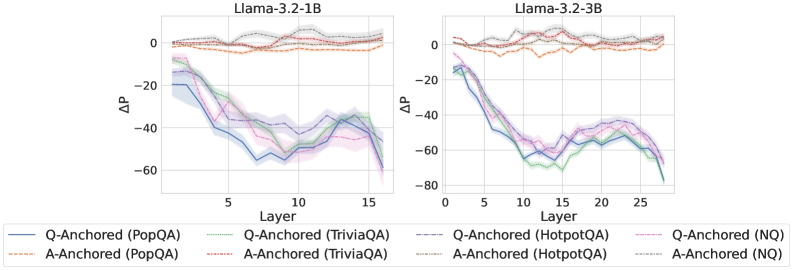
The image presents two line charts comparing the performance of Llama-3.2-1B and Llama-3.2-3B models across different layers. The charts depict the change in performance (ΔP) as a function of layer number for various question answering tasks, using both question-anchored (Q-Anchored) and answer-anchored (A-Anchored) approaches.
### Components/Axes
* **Titles:**
* Left Chart: Llama-3.2-1B
* Right Chart: Llama-3.2-3B
* **Y-Axis (ΔP):**
* Scale: -80 to 0
* Units: ΔP (Change in Performance)
* Markers: 0, -20, -40, -60, -80 (only on right chart)
* **X-Axis (Layer):**
* Left Chart: Layer (1 to 16)
* Right Chart: Layer (0 to 27)
* Markers:
* Left Chart: 5, 10, 15
* Right Chart: 5, 10, 15, 20, 25
* **Legend (Bottom):**
* Q-Anchored (PopQA): Solid Blue Line
* A-Anchored (PopQA): Dashed Orange Line
* Q-Anchored (TriviaQA): Dotted Green Line
* A-Anchored (TriviaQA): Dotted Gray Line
* Q-Anchored (HotpotQA): Dash-Dot Purple Line
* A-Anchored (HotpotQA): Dash-Dot Red Line
* Q-Anchored (NQ): Dashed Pink Line
* A-Anchored (NQ): Dotted-Dashed Black Line
### Detailed Analysis
**Llama-3.2-1B (Left Chart):**
* **Q-Anchored (PopQA):** (Solid Blue Line) Starts at approximately -20 ΔP at Layer 1, decreases to approximately -60 ΔP by Layer 16.
* **A-Anchored (PopQA):** (Dashed Orange Line) Remains relatively stable around 0 ΔP across all layers.
* **Q-Anchored (TriviaQA):** (Dotted Green Line) Starts at approximately -20 ΔP at Layer 1, decreases to approximately -40 ΔP by Layer 16.
* **A-Anchored (TriviaQA):** (Dotted Gray Line) Remains relatively stable around 0 ΔP across all layers.
* **Q-Anchored (HotpotQA):** (Dash-Dot Purple Line) Starts at approximately -10 ΔP at Layer 1, decreases to approximately -40 ΔP by Layer 16.
* **A-Anchored (HotpotQA):** (Dash-Dot Red Line) Remains relatively stable around 0 ΔP across all layers.
* **Q-Anchored (NQ):** (Dashed Pink Line) Starts at approximately -10 ΔP at Layer 1, decreases to approximately -40 ΔP by Layer 16.
* **A-Anchored (NQ):** (Dotted-Dashed Black Line) Remains relatively stable around 0 ΔP across all layers.
**Llama-3.2-3B (Right Chart):**
* **Q-Anchored (PopQA):** (Solid Blue Line) Starts at approximately -20 ΔP at Layer 1, decreases to approximately -70 ΔP by Layer 27.
* **A-Anchored (PopQA):** (Dashed Orange Line) Remains relatively stable around 0 ΔP across all layers.
* **Q-Anchored (TriviaQA):** (Dotted Green Line) Starts at approximately -20 ΔP at Layer 1, decreases to approximately -70 ΔP by Layer 27.
* **A-Anchored (TriviaQA):** (Dotted Gray Line) Remains relatively stable around 0 ΔP across all layers.
* **Q-Anchored (HotpotQA):** (Dash-Dot Purple Line) Starts at approximately -10 ΔP at Layer 1, decreases to approximately -60 ΔP by Layer 27.
* **A-Anchored (HotpotQA):** (Dash-Dot Red Line) Remains relatively stable around 0 ΔP across all layers.
* **Q-Anchored (NQ):** (Dashed Pink Line) Starts at approximately -10 ΔP at Layer 1, decreases to approximately -60 ΔP by Layer 27.
* **A-Anchored (NQ):** (Dotted-Dashed Black Line) Remains relatively stable around 0 ΔP across all layers.
### Key Observations
* **Q-Anchored Performance Decrease:** For both models, the Q-Anchored approaches (PopQA, TriviaQA, HotpotQA, NQ) show a decrease in ΔP as the layer number increases.
* **A-Anchored Stability:** The A-Anchored approaches (PopQA, TriviaQA, HotpotQA, NQ) maintain a relatively stable ΔP around 0 across all layers for both models.
* **Model Comparison:** The Llama-3.2-3B model (right chart) has more layers (up to 27) compared to Llama-3.2-1B (left chart, up to 16). The Q-Anchored performance decrease appears more pronounced in Llama-3.2-3B.
### Interpretation
The data suggests that as the layer number increases, the performance of question-anchored approaches decreases, indicating a potential degradation in the model's ability to leverage information from the question itself in deeper layers. The answer-anchored approaches, on the other hand, maintain stable performance, suggesting that anchoring on the answer might provide more consistent results across different layers. The Llama-3.2-3B model, with its increased number of layers, exhibits a more pronounced performance decrease in the Q-Anchored approaches, which could indicate that the model's ability to process question-related information diminishes more significantly with increasing depth.