\n
## Line Charts: Per-Period Regret vs. Time Period for Different Agent Configurations
### Overview
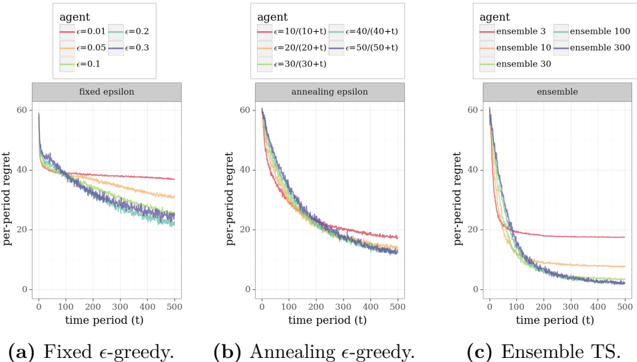
The image presents three line charts, labeled (a) Fixed ε-greedy, (b) Annealing ε-greedy, and (c) Ensemble TS. Each chart depicts the relationship between per-period regret (y-axis) and time period (t) (x-axis) for different agent configurations. The charts compare the performance of various parameter settings within each agent type.
### Components/Axes
* **X-axis:** Time period (t), ranging from approximately 0 to 500.
* **Y-axis:** Per-period regret, ranging from approximately 0 to 60.
* **Chart (a) - Fixed ε-greedy:**
* Legend:
* ε = 0.01 (Pink)
* ε = 0.05 (Green)
* ε = 0.1 (Purple)
* ε = 0.2 (Orange)
* ε = 0.3 (Brown)
* **Chart (b) - Annealing ε-greedy:**
* Legend:
* ε = 10/(10+t) (Pink)
* ε = 20/(20+t) (Green)
* ε = 30/(30+t) (Purple)
* ε = 40/(40+t) (Orange)
* ε = 50/(50+t) (Brown)
* **Chart (c) - Ensemble TS:**
* Legend:
* ensemble 3 (Pink)
* ensemble 10 (Green)
* ensemble 30 (Purple)
* ensemble 100 (Orange)
* ensemble 300 (Brown)
### Detailed Analysis or Content Details
**Chart (a) - Fixed ε-greedy:**
* The pink line (ε = 0.01) starts at approximately 55 and decreases rapidly to around 10 by t=100, then plateaus around 8-10.
* The green line (ε = 0.05) starts at approximately 55 and decreases to around 15 by t=100, then plateaus around 12-14.
* The purple line (ε = 0.1) starts at approximately 55 and decreases to around 20 by t=100, then plateaus around 16-18.
* The orange line (ε = 0.2) starts at approximately 55 and decreases to around 25 by t=100, then plateaus around 20-22.
* The brown line (ε = 0.3) starts at approximately 55 and decreases to around 30 by t=100, then plateaus around 25-27.
* All lines exhibit a decreasing trend, but the rate of decrease varies with ε. Lower ε values result in faster initial decreases and lower final regret values.
**Chart (b) - Annealing ε-greedy:**
* The pink line (ε = 10/(10+t)) starts at approximately 55 and decreases rapidly to around 8 by t=100, then continues to decrease slowly, reaching around 5 by t=500.
* The green line (ε = 20/(20+t)) starts at approximately 55 and decreases rapidly to around 12 by t=100, then continues to decrease slowly, reaching around 8 by t=500.
* The purple line (ε = 30/(30+t)) starts at approximately 55 and decreases rapidly to around 16 by t=100, then continues to decrease slowly, reaching around 11 by t=500.
* The orange line (ε = 40/(40+t)) starts at approximately 55 and decreases rapidly to around 20 by t=100, then continues to decrease slowly, reaching around 14 by t=500.
* The brown line (ε = 50/(50+t)) starts at approximately 55 and decreases rapidly to around 24 by t=100, then continues to decrease slowly, reaching around 17 by t=500.
* Similar to Chart (a), all lines decrease over time, but the rate of decrease is influenced by the annealing schedule.
**Chart (c) - Ensemble TS:**
* The pink line (ensemble 3) starts at approximately 55 and decreases rapidly to around 10 by t=100, then plateaus around 6-8.
* The green line (ensemble 10) starts at approximately 55 and decreases rapidly to around 8 by t=100, then plateaus around 5-7.
* The purple line (ensemble 30) starts at approximately 55 and decreases rapidly to around 7 by t=100, then plateaus around 4-6.
* The orange line (ensemble 100) starts at approximately 55 and decreases rapidly to around 6 by t=100, then plateaus around 3-5.
* The brown line (ensemble 300) starts at approximately 55 and decreases rapidly to around 5 by t=100, then plateaus around 2-4.
* All lines exhibit a decreasing trend, with larger ensemble sizes generally leading to lower regret values.
### Key Observations
* In all three charts, the per-period regret decreases over time, indicating learning and improvement in the agents' performance.
* Chart (c) (Ensemble TS) consistently shows the lowest regret values across all ensemble sizes, suggesting that ensemble methods are more effective at minimizing regret.
* In Chart (a) (Fixed ε-greedy), lower ε values lead to better performance (lower regret).
* In Chart (b) (Annealing ε-greedy), the initial rate of exploration decreases as time progresses, leading to a gradual reduction in regret.
### Interpretation
The data suggests that the choice of agent configuration significantly impacts the per-period regret. Ensemble methods (Chart c) consistently outperform both fixed and annealing ε-greedy approaches. Within the fixed ε-greedy approach (Chart a), a lower exploration rate (lower ε) leads to better performance, but may also result in slower initial learning. The annealing ε-greedy approach (Chart b) provides a balance between exploration and exploitation, allowing the agent to adapt its exploration rate over time. The consistent downward trend in all charts indicates that the agents are learning from their experiences and improving their decision-making over time. The ensemble methods likely benefit from averaging out the predictions of multiple agents, reducing the variance and improving the overall performance. The plateaus observed in the later stages of the charts suggest that the agents have converged to a near-optimal policy.