TECHNICAL ASSET FINGERPRINT
2029ff43d1bb85841236ee78
Click to view fullscreen
Press ESC or click to close
FOUND IN PAPERS
EXPERT: healer-alpha-free VERSION 1
RUNTIME: free/openrouter/healer-alpha
INTEL_VERIFIED
## Multi-Panel Technical Figure: Brain Alignment and Transformer Architecture Analysis
### Overview
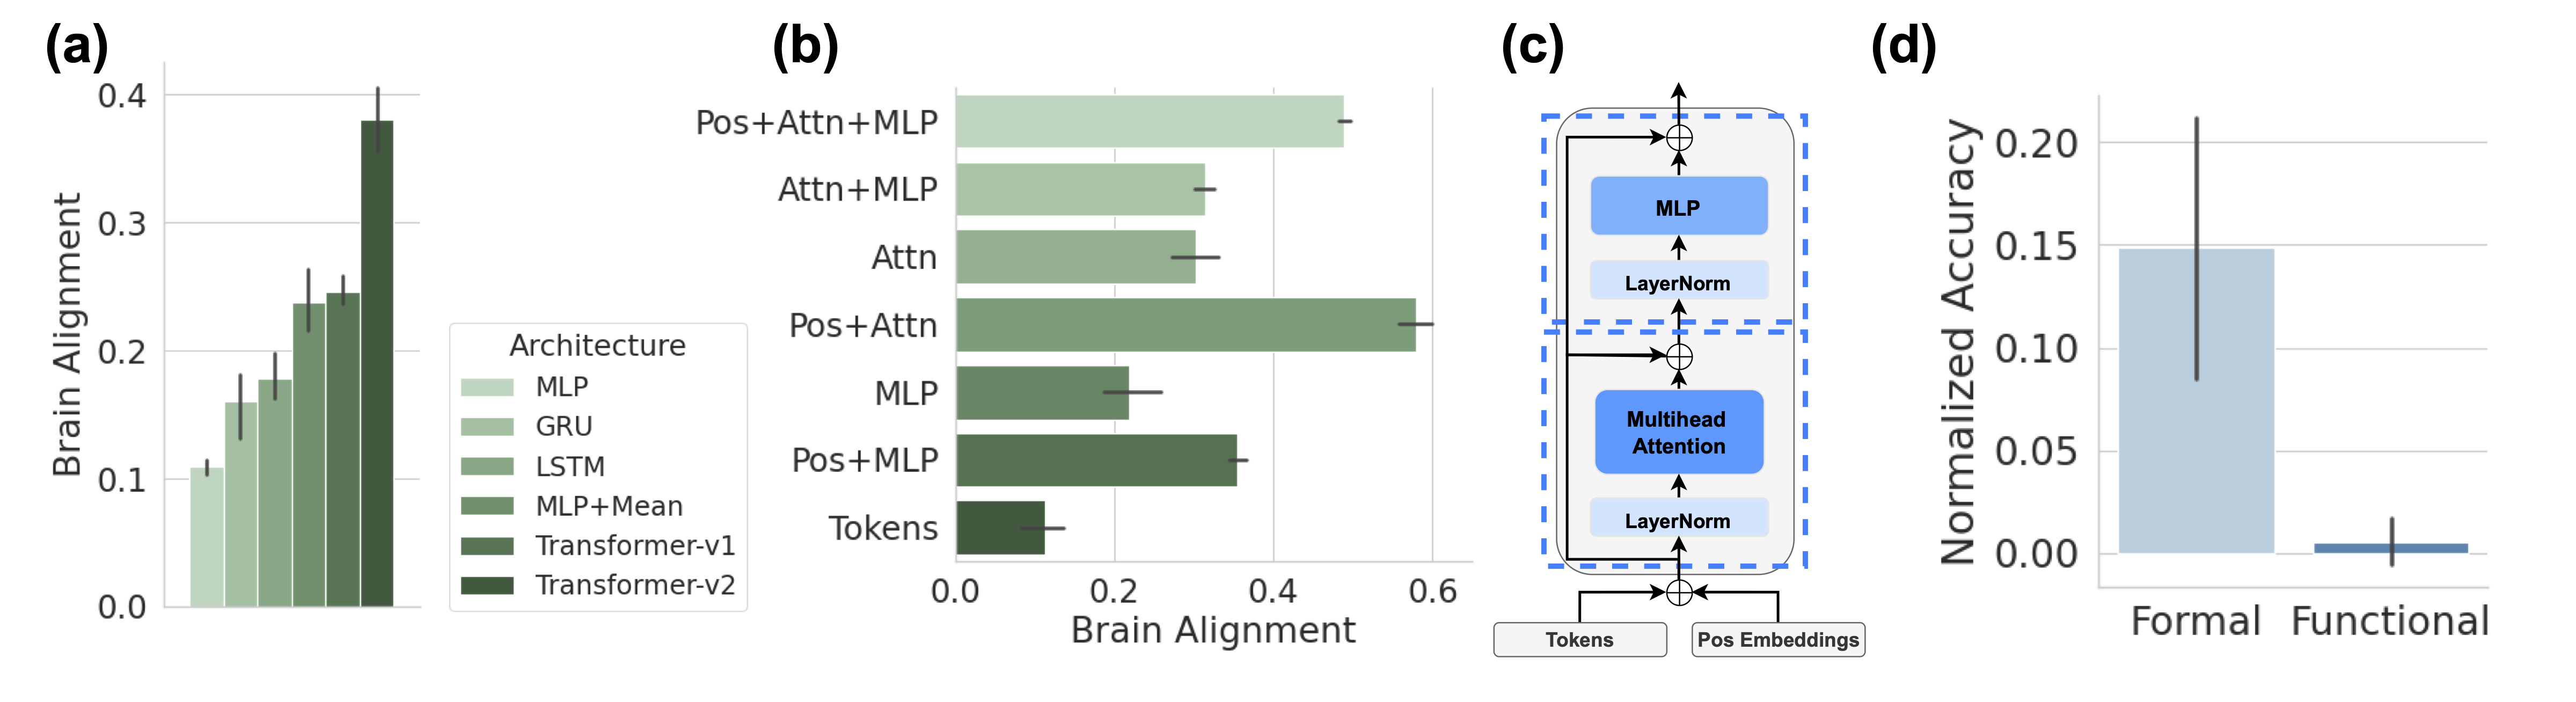
The image is a composite figure containing four distinct panels labeled (a) through (d). It presents a comparative analysis of different neural network architectures' alignment with brain data, a schematic of a Transformer block, and a comparison of normalized accuracy between "Formal" and "Functional" categories. The overall theme appears to be evaluating how well artificial neural network components and architectures mimic or align with biological brain processing.
### Components/Axes
**Panel (a): Vertical Bar Chart**
* **Title/Label:** (a)
* **Y-axis:** "Brain Alignment" (Scale: 0.0 to 0.4, with major ticks at 0.1 intervals).
* **X-axis:** Implicitly represents different architectures, defined by the legend.
* **Legend:** Located to the right of the chart. Title: "Architecture". Contains six entries with corresponding color swatches (shades of green, from light to dark):
1. MLP (lightest green)
2. GRU
3. LSTM
4. MLP+Mean
5. Transformer-v1
6. Transformer-v2 (darkest green)
* **Data Series:** Six vertical bars, one per architecture, with error bars (vertical lines) indicating variability.
**Panel (b): Horizontal Bar Chart**
* **Title/Label:** (b)
* **X-axis:** "Brain Alignment" (Scale: 0.0 to 0.6, with major ticks at 0.2 intervals).
* **Y-axis:** Lists seven component combinations (from top to bottom):
1. Pos+Attn+MLP
2. Attn+MLP
3. Attn
4. Pos+Attn
5. MLP
6. Pos+MLP
7. Tokens
* **Data Series:** Seven horizontal bars, one per component combination, with error bars (horizontal lines).
**Panel (c): Transformer Block Diagram**
* **Title/Label:** (c)
* **Components (from bottom to top):**
* Input boxes: "Tokens" and "Pos Embeddings".
* Addition operation (⊕ symbol).
* "LayerNorm" block.
* "Multihead Attention" block (blue).
* Addition operation (⊕ symbol) with a residual connection from below the first LayerNorm.
* "LayerNorm" block.
* "MLP" block (blue).
* Addition operation (⊕ symbol) with a residual connection from below the second LayerNorm.
* Output arrow.
* **Flow:** The diagram is enclosed in a dashed blue rectangle. Arrows indicate the forward data flow. The structure shows two main sub-layers (Multihead Attention and MLP), each followed by a LayerNorm and a residual connection (skip connection) that adds the sub-layer's input to its output.
**Panel (d): Vertical Bar Chart**
* **Title/Label:** (d)
* **Y-axis:** "Normalized Accuracy" (Scale: 0.00 to 0.20, with major ticks at 0.05 intervals).
* **X-axis:** Two categories: "Formal" and "Functional".
* **Data Series:** Two vertical bars.
* "Formal": A tall, light blue bar with a very large error bar.
* "Functional": A very short, dark blue bar with a small error bar.
### Detailed Analysis
**Panel (a) - Architecture Comparison:**
* **Trend:** Brain Alignment increases progressively across the architectures from left to right.
* **Approximate Values (Visual Estimation):**
* MLP: ~0.11
* GRU: ~0.16
* LSTM: ~0.18
* MLP+Mean: ~0.24
* Transformer-v1: ~0.25
* Transformer-v2: ~0.38
* **Error Bars:** All bars have error bars. The error bar for Transformer-v2 is the largest, extending from approximately 0.35 to 0.41.
**Panel (b) - Component Contribution:**
* **Trend:** The combination "Pos+Attn+MLP" yields the highest Brain Alignment. "Tokens" alone yields the lowest.
* **Approximate Values (Visual Estimation):**
* Pos+Attn+MLP: ~0.50
* Attn+MLP: ~0.32
* Attn: ~0.30
* Pos+Attn: ~0.58 (Note: This bar is longer than Pos+Attn+MLP, suggesting a potential anomaly or specific condition. The label order on the Y-axis does not strictly correspond to bar length.)
* MLP: ~0.22
* Pos+MLP: ~0.36
* Tokens: ~0.10
* **Error Bars:** All bars have error bars. The error bar for "Pos+Attn" is notably wide.
**Panel (c) - Architecture Schematic:**
* This is a standard depiction of a Transformer encoder block. The key features are the stacked sub-layers (Multihead Attention and MLP), the use of Layer Normalization (LayerNorm) before each sub-layer (a "pre-norm" variant), and the residual connections that bypass each sub-layer.
**Panel (d) - Accuracy Comparison:**
* **Formal:** The bar reaches approximately 0.15. Its error bar is extremely large, spanning from roughly 0.08 to 0.22.
* **Functional:** The bar is very close to 0.00, perhaps ~0.01. Its error bar is small, ranging from about 0.00 to 0.02.
### Key Observations
1. **Architecture Hierarchy:** There is a clear hierarchy in Brain Alignment: simple MLP < recurrent units (GRU, LSTM) < more complex MLP variants < Transformers. Transformer-v2 shows a substantial jump over Transformer-v1.
2. **Component Synergy:** Panel (b) suggests that combining Positional Embeddings (Pos), Attention (Attn), and MLP yields high alignment, but the "Pos+Attn" bar being the longest is a critical observation that requires context (it may represent a specific experimental condition).
3. **High Variance in Formal Tasks:** Panel (d) shows that while the "Formal" category has a much higher mean normalized accuracy than "Functional," it also exhibits vastly greater variability (as shown by the large error bar).
4. **Diagram Clarity:** Panel (c) clearly isolates the core computational components of a modern Transformer, providing a reference for the component names used in Panel (b).
### Interpretation
This figure collectively investigates the representational power of artificial neural networks in relation to brain data. The progression in Panel (a) suggests that architectures with attention mechanisms and positional information (Transformers) achieve higher "Brain Alignment" than recurrent or simple feedforward networks. Panel (b) deconstructs this further, implying that the integration of positional information with attention is particularly crucial, though the exact relationship between the component combinations needs the accompanying paper's context for full explanation.
The schematic in Panel (c) defines the architectural vocabulary (MLP, Attention, LayerNorm) used in the analysis. Finally, Panel (d) introduces a separate but related metric, "Normalized Accuracy," revealing a stark contrast between "Formal" and "Functional" tasks. The high mean and variance for "Formal" could indicate that models perform well on structured, rule-based tasks but with inconsistent results, while they fail almost completely on "Functional" tasks, which may be more open-ended or context-dependent.
**Overall Implication:** The data argues that the inductive biases present in Transformer architectures—specifically the combination of self-attention and positional encoding—may be more aligned with the processing principles of the human brain than those of earlier architectures. However, the performance on downstream tasks (Panel d) is highly dependent on the task type, showing significant instability in formal domains and near-failure in functional ones.
DECODING INTELLIGENCE...