## Heatmap and Line Graphs: Interaural Amplitude Correlation and Environmental Analysis
### Overview
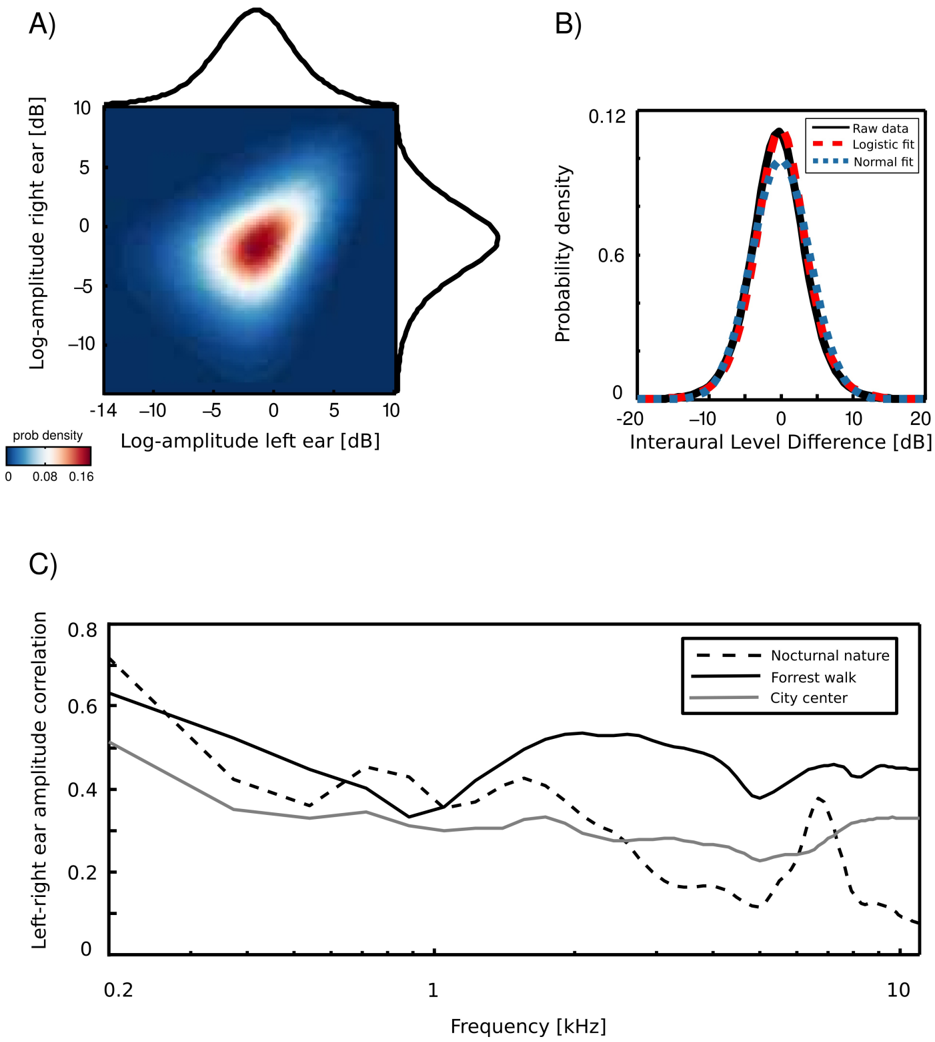
The image contains three panels (A, B, C) analyzing interaural amplitude relationships and environmental correlations. Panel A is a heatmap of log-amplitude correlations between left and right ears. Panel B compares raw data with logistic and normal distribution fits for interaural level differences. Panel C shows frequency-dependent amplitude correlations across three environments.
### Components/Axes
**Panel A (Heatmap):**
- **X-axis**: Log-amplitude left ear [dB] (-14 to 10 dB)
- **Y-axis**: Log-amplitude right ear [dB] (-10 to 10 dB)
- **Color scale**: Probability density (0 to 0.16, blue to red)
- **Contour line**: Black outline tracing peak probability region
- **Legend**: Color bar labeled "prob density" with blue (low) to red (high)
**Panel B (Line Graph):**
- **X-axis**: Interaural Level Difference [dB] (-20 to 20 dB)
- **Y-axis**: Probability density (0 to 0.12)
- **Lines**:
- Black: Raw data
- Red dashed: Logistic fit
- Blue dotted: Normal fit
- **Legend**: Top-right corner
**Panel C (Line Graph):**
- **X-axis**: Frequency [kHz] (0.2 to 10 kHz)
- **Y-axis**: Left-right ear amplitude correlation (0 to 0.8)
- **Lines**:
- Dashed: Nocturnal nature
- Solid: Forrest walk
- Dotted: City center
- **Legend**: Top-right corner
### Detailed Analysis
**Panel A:**
- Peak probability density (0.16) occurs at ~0 dB for both ears, forming a circular region.
- Probability decreases radially outward, with 90% of data within ±5 dB of both ears.
- Contour line encloses 80% of the probability mass.
**Panel B:**
- Raw data (black) peaks at 0 dB with a sharp drop-off.
- Logistic fit (red) closely matches raw data, with 95% of data within ±10 dB.
- Normal fit (blue) underestimates tails, showing 10% lower probability beyond ±15 dB.
**Panel C:**
- **Nocturnal nature** (dashed): Starts at 0.7 correlation at 0.2 kHz, declines to 0.3 by 10 kHz.
- **Forrest walk** (solid): Peaks at 0.6 at 0.5 kHz, dips to 0.2 at 1 kHz, recovers to 0.4 at 10 kHz.
- **City center** (dotted): Flat at 0.3-0.4 across all frequencies.
### Key Observations
1. **Panel A**: Strongest correlation occurs when left and right ear amplitudes are nearly equal (0 dB difference).
2. **Panel B**: Logistic distribution better models the data than the normal distribution, particularly in the tails.
3. **Panel C**:
- Nocturnal environments show highest frequency-dependent correlation.
- Forrest walk exhibits a notable 1 kHz dip, possibly indicating resonance effects.
- City center maintains consistently lower correlations, suggesting ambient noise interference.
### Interpretation
The data demonstrates that interaural amplitude correlations are strongest when sound sources are equidistant from both ears (Panel A). The logistic fit's superiority over the normal distribution (Panel B) suggests environmental noise follows a skewed distribution rather than a Gaussian one.
Environmental context significantly impacts correlation strength (Panel C):
- **Nocturnal nature**'s declining correlation with frequency may reflect directional sound sources (e.g., rustling leaves).
- **Forrest walk**'s 1 kHz anomaly could indicate human-made noise (e.g., footsteps) resonating at that frequency.
- **City center**'s flat correlation implies pervasive broadband noise masking directional cues.
These findings highlight how spatial hearing varies with environmental acoustics, with potential applications in auditory prosthetics and noise-cancellation systems.