\n
## Bar and Line Chart: Web Search Frequency vs. IKG Coverage with/without Penalty
### Overview
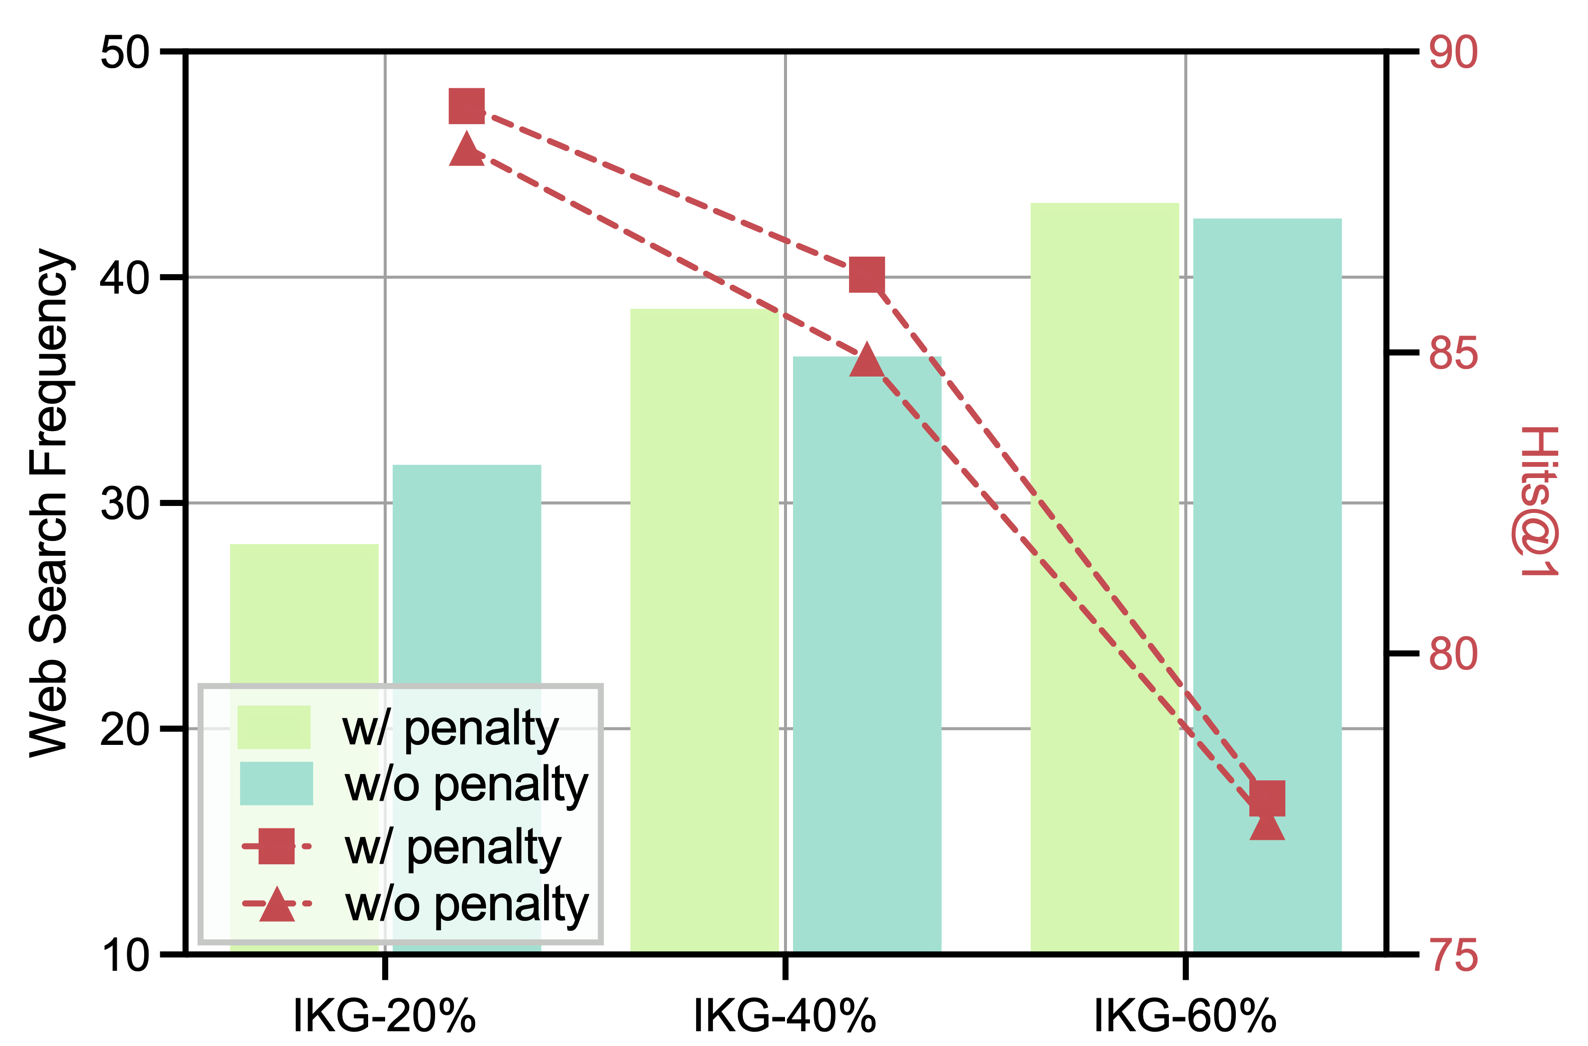
This chart compares the web search frequency and Hits@1 scores for different levels of IKG (Information Knowledge Graph) coverage, with and without a penalty applied. The x-axis represents IKG coverage levels (20%, 40%, and 60%). The left y-axis shows web search frequency, and the right y-axis shows Hits@1 scores. The data is presented using bar charts for web search frequency and a line chart for Hits@1.
### Components/Axes
* **X-axis:** IKG Coverage (IKG-20%, IKG-40%, IKG-60%)
* **Left Y-axis:** Web Search Frequency (Scale: 10 to 50)
* **Right Y-axis:** Hits@1 (Scale: 75 to 90)
* **Legend:**
* Light Green: w/ penalty (Web Search Frequency)
* Light Blue: w/o penalty (Web Search Frequency)
* Dark Green Square: w/ penalty (Hits@1)
* Red Dashed Line: w/o penalty (Hits@1)
### Detailed Analysis
**Web Search Frequency (Bar Charts):**
* **w/ penalty (Light Green):**
* IKG-20%: Approximately 31.
* IKG-40%: Approximately 38.
* IKG-60%: Approximately 44.
* Trend: The light green bars show an upward trend, indicating increasing web search frequency as IKG coverage increases.
* **w/o penalty (Light Blue):**
* IKG-20%: Approximately 47.
* IKG-40%: Approximately 35.
* IKG-60%: Approximately 28.
* Trend: The light blue bars show a downward trend, indicating decreasing web search frequency as IKG coverage increases.
**Hits@1 (Line Chart):**
* **w/ penalty (Dark Green Square):**
* IKG-20%: Approximately 87.
* IKG-40%: Approximately 83.
* IKG-60%: Approximately 78.
* Trend: The dark green line slopes downward, indicating decreasing Hits@1 scores as IKG coverage increases.
* **w/o penalty (Red Dashed Line):**
* IKG-20%: Approximately 48.
* IKG-40%: Approximately 42.
* IKG-60%: Approximately 77.
* Trend: The red dashed line also slopes downward, indicating decreasing Hits@1 scores as IKG coverage increases.
### Key Observations
* The web search frequency behaves oppositely with and without the penalty. With the penalty, frequency increases with IKG coverage; without the penalty, it decreases.
* Hits@1 scores decrease with increasing IKG coverage for both scenarios (with and without penalty).
* The difference in Hits@1 between the "with penalty" and "without penalty" scenarios is significant, especially at lower IKG coverage levels.
* The "without penalty" line starts at a much lower Hits@1 score than the "with penalty" square.
### Interpretation
The chart suggests that applying a penalty influences the relationship between IKG coverage and web search frequency. Without a penalty, increased IKG coverage appears to *reduce* the frequency of web searches, potentially because the IKG provides sufficient information directly. However, with a penalty, increased IKG coverage *increases* web search frequency, possibly because the penalty encourages exploration of more diverse sources.
The consistent decrease in Hits@1 scores with increasing IKG coverage, regardless of the penalty, indicates that while IKG coverage might affect search frequency, it doesn't necessarily improve the accuracy of the top search result (as measured by Hits@1). This could be due to issues with the quality of information within the IKG, or the way the IKG is integrated into the search process.
The large initial difference in Hits@1 between the two scenarios suggests that the penalty has a substantial impact on the relevance of search results, particularly at lower IKG coverage levels. The penalty seems to improve the initial relevance, but the benefit diminishes as IKG coverage increases. This could indicate that the penalty is most effective when the IKG is less comprehensive.