## Line Chart: EGA vs. Episode for Different Initial Conditions (x₀)
### Overview
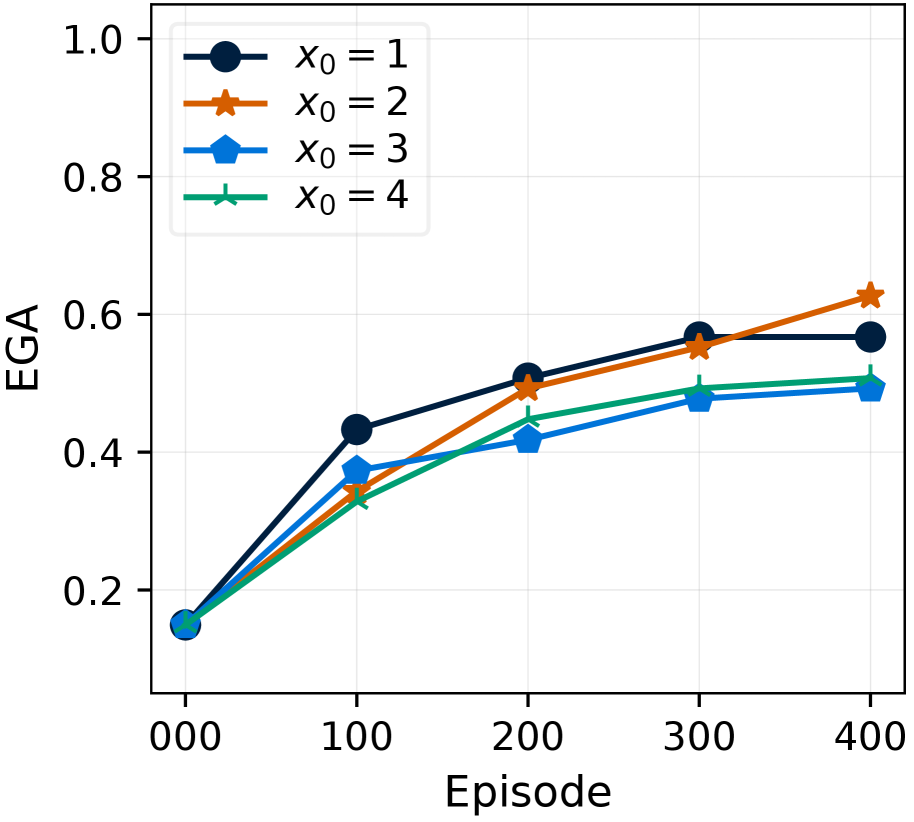
The image displays a line chart plotting the performance metric "EGA" against "Episode" for four distinct experimental conditions, differentiated by their initial value parameter, x₀. The chart illustrates how the EGA metric evolves over 400 episodes for each condition, showing learning or performance curves.
### Components/Axes
* **Chart Type:** Multi-series line chart with markers.
* **X-Axis:**
* **Label:** "Episode"
* **Scale:** Linear, from 0 to 400.
* **Tick Marks:** 000, 100, 200, 300, 400.
* **Y-Axis:**
* **Label:** "EGA"
* **Scale:** Linear, from 0.0 to 1.0.
* **Tick Marks:** 0.0, 0.2, 0.4, 0.6, 0.8, 1.0.
* **Legend:** Located in the top-left corner of the plot area. It defines four data series:
1. **x₀ = 1:** Dark blue line with circle markers.
2. **x₀ = 2:** Orange line with star markers.
3. **x₀ = 3:** Blue line with pentagon markers.
4. **x₀ = 4:** Green line with 'x' (cross) markers.
* **Grid:** Light gray grid lines are present for both major x and y ticks.
### Detailed Analysis
**Data Series and Trends:**
1. **x₀ = 1 (Dark Blue, Circles):**
* **Trend:** Shows a steep initial increase, then plateaus.
* **Approximate Data Points:**
* Episode 000: EGA ≈ 0.15
* Episode 100: EGA ≈ 0.43
* Episode 200: EGA ≈ 0.51
* Episode 300: EGA ≈ 0.57
* Episode 400: EGA ≈ 0.57
2. **x₀ = 2 (Orange, Stars):**
* **Trend:** Shows a steady, near-linear increase throughout, ending as the highest-performing series.
* **Approximate Data Points:**
* Episode 000: EGA ≈ 0.15
* Episode 100: EGA ≈ 0.34
* Episode 200: EGA ≈ 0.49
* Episode 300: EGA ≈ 0.55
* Episode 400: EGA ≈ 0.62
3. **x₀ = 3 (Blue, Pentagons):**
* **Trend:** Increases at a moderate rate, consistently performing below the x₀=1 and x₀=2 series after Episode 100.
* **Approximate Data Points:**
* Episode 000: EGA ≈ 0.15
* Episode 100: EGA ≈ 0.37
* Episode 200: EGA ≈ 0.42
* Episode 300: EGA ≈ 0.47
* Episode 400: EGA ≈ 0.49
4. **x₀ = 4 (Green, Crosses):**
* **Trend:** Follows a trajectory very similar to x₀=3, with slightly higher values at later episodes.
* **Approximate Data Points:**
* Episode 000: EGA ≈ 0.15
* Episode 100: EGA ≈ 0.33
* Episode 200: EGA ≈ 0.44
* Episode 300: EGA ≈ 0.49
* Episode 400: EGA ≈ 0.51
**Spatial Grounding & Cross-Reference:**
* All four lines originate from the same point at Episode 000 (EGA ≈ 0.15).
* The legend is positioned in the top-left, overlapping the grid but not obscuring data points.
* The color and marker for each line have been verified against the legend at multiple points (start, middle, end) to ensure accurate series identification.
### Key Observations
1. **Common Starting Point:** All conditions begin with identical performance (EGA ≈ 0.15) at Episode 0.
2. **Performance Crossover:** The x₀=1 series (dark blue) leads initially but is overtaken by x₀=2 (orange) between Episodes 300 and 400.
3. **Clustering:** The x₀=3 (blue) and x₀=4 (green) series cluster together, performing similarly but distinctly lower than the top two series after the initial episodes.
4. **Plateau vs. Growth:** The x₀=1 series appears to plateau after Episode 300, while the x₀=2 series continues a clear upward trend.
5. **Final Ranking (Episode 400):** From highest to lowest EGA: x₀=2 > x₀=1 > x₀=4 > x₀=3.
### Interpretation
This chart likely visualizes the results of a reinforcement learning or optimization experiment where "EGA" is a performance metric (e.g., Expected Gain Average, Episodic Goal Achievement) and "Episode" represents training iterations. The parameter `x₀` represents different initial conditions or hyperparameter settings for the agent or system.
The data suggests that the initial condition `x₀=2` yields the most favorable long-term learning trajectory, resulting in the highest final performance. While `x₀=1` enables faster initial learning, it saturates earlier. The conditions `x₀=3` and `x₀=4` lead to slower and ultimately lower performance. This implies a non-monotonic relationship between the initial parameter `x₀` and final performance; a middle value (`x₀=2`) is optimal in this context. The convergence of all lines at the start confirms a controlled experimental setup. The chart effectively communicates that tuning the `x₀` parameter is critical for both the speed of learning and the ultimate performance ceiling achieved by the system.