\n
## Scatter Plot: Confidence vs. Target Length for "high_school_us_history"
### Overview
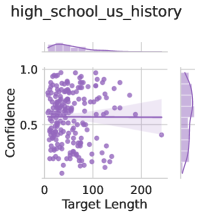
The image presents a scatter plot visualizing the relationship between "Target Length" and "Confidence" for the topic "high_school_us_history". A density plot is shown at the top, and a histogram is shown on the right. The plot displays a large number of data points, with a shaded region representing a confidence interval.
### Components/Axes
* **Title:** "high\_school\_us\_history" (top-center)
* **X-axis:** "Target Length" (bottom-center), ranging from approximately 0 to 250.
* **Y-axis:** "Confidence" (left-center), ranging from approximately 0.2 to 1.0.
* **Data Points:** Numerous purple dots scattered across the plot.
* **Confidence Interval:** A shaded purple region surrounding a horizontal line.
* **Density Plot:** A purple density plot at the top of the chart, showing the distribution of confidence values.
* **Histogram:** A purple histogram on the right side of the chart, showing the distribution of target length values.
### Detailed Analysis
The scatter plot shows a weak, potentially non-linear relationship between "Target Length" and "Confidence".
* **Data Point Distribution:** The majority of data points cluster between "Target Length" values of 0 and 150, with "Confidence" values generally between 0.4 and 0.8. There is a noticeable spread in the data, indicating variability in confidence levels for similar target lengths.
* **Confidence Interval:** The horizontal line representing the average confidence is approximately at 0.55. The shaded region indicates a 95% confidence interval, extending from approximately 0.45 to 0.65.
* **Density Plot:** The density plot at the top shows a peak in confidence values around 0.55, with a slight decrease in density towards lower confidence levels.
* **Histogram:** The histogram on the right shows a concentration of target lengths between 0 and 100, with a tail extending towards higher values.
Approximate Data Points (sampled for illustration):
* (Target Length: 20, Confidence: 0.6)
* (Target Length: 50, Confidence: 0.5)
* (Target Length: 100, Confidence: 0.7)
* (Target Length: 150, Confidence: 0.45)
* (Target Length: 200, Confidence: 0.65)
* (Target Length: 230, Confidence: 0.75)
### Key Observations
* There is no strong correlation between "Target Length" and "Confidence".
* The confidence interval is relatively narrow, suggesting a consistent level of confidence across different target lengths.
* The distribution of target lengths is skewed towards lower values.
* The density plot indicates that the most common confidence level is around 0.55.
### Interpretation
The data suggests that the length of the target does not significantly impact the confidence level for the "high\_school\_us\_history" topic. The relatively stable confidence interval indicates that the model or system being evaluated maintains a consistent level of certainty regardless of the target length. The skew in the target length distribution might indicate that most queries or tasks related to this topic involve shorter targets. The lack of a strong correlation could be due to other factors influencing confidence, such as the complexity of the target content or the quality of the input data. The data does not reveal the nature of the "Target Length" (e.g., word count, character count, etc.), which limits a deeper understanding of the relationship.