\n
## Bar Chart: Throughput vs. Accuracy for Different Top-k Values
### Overview
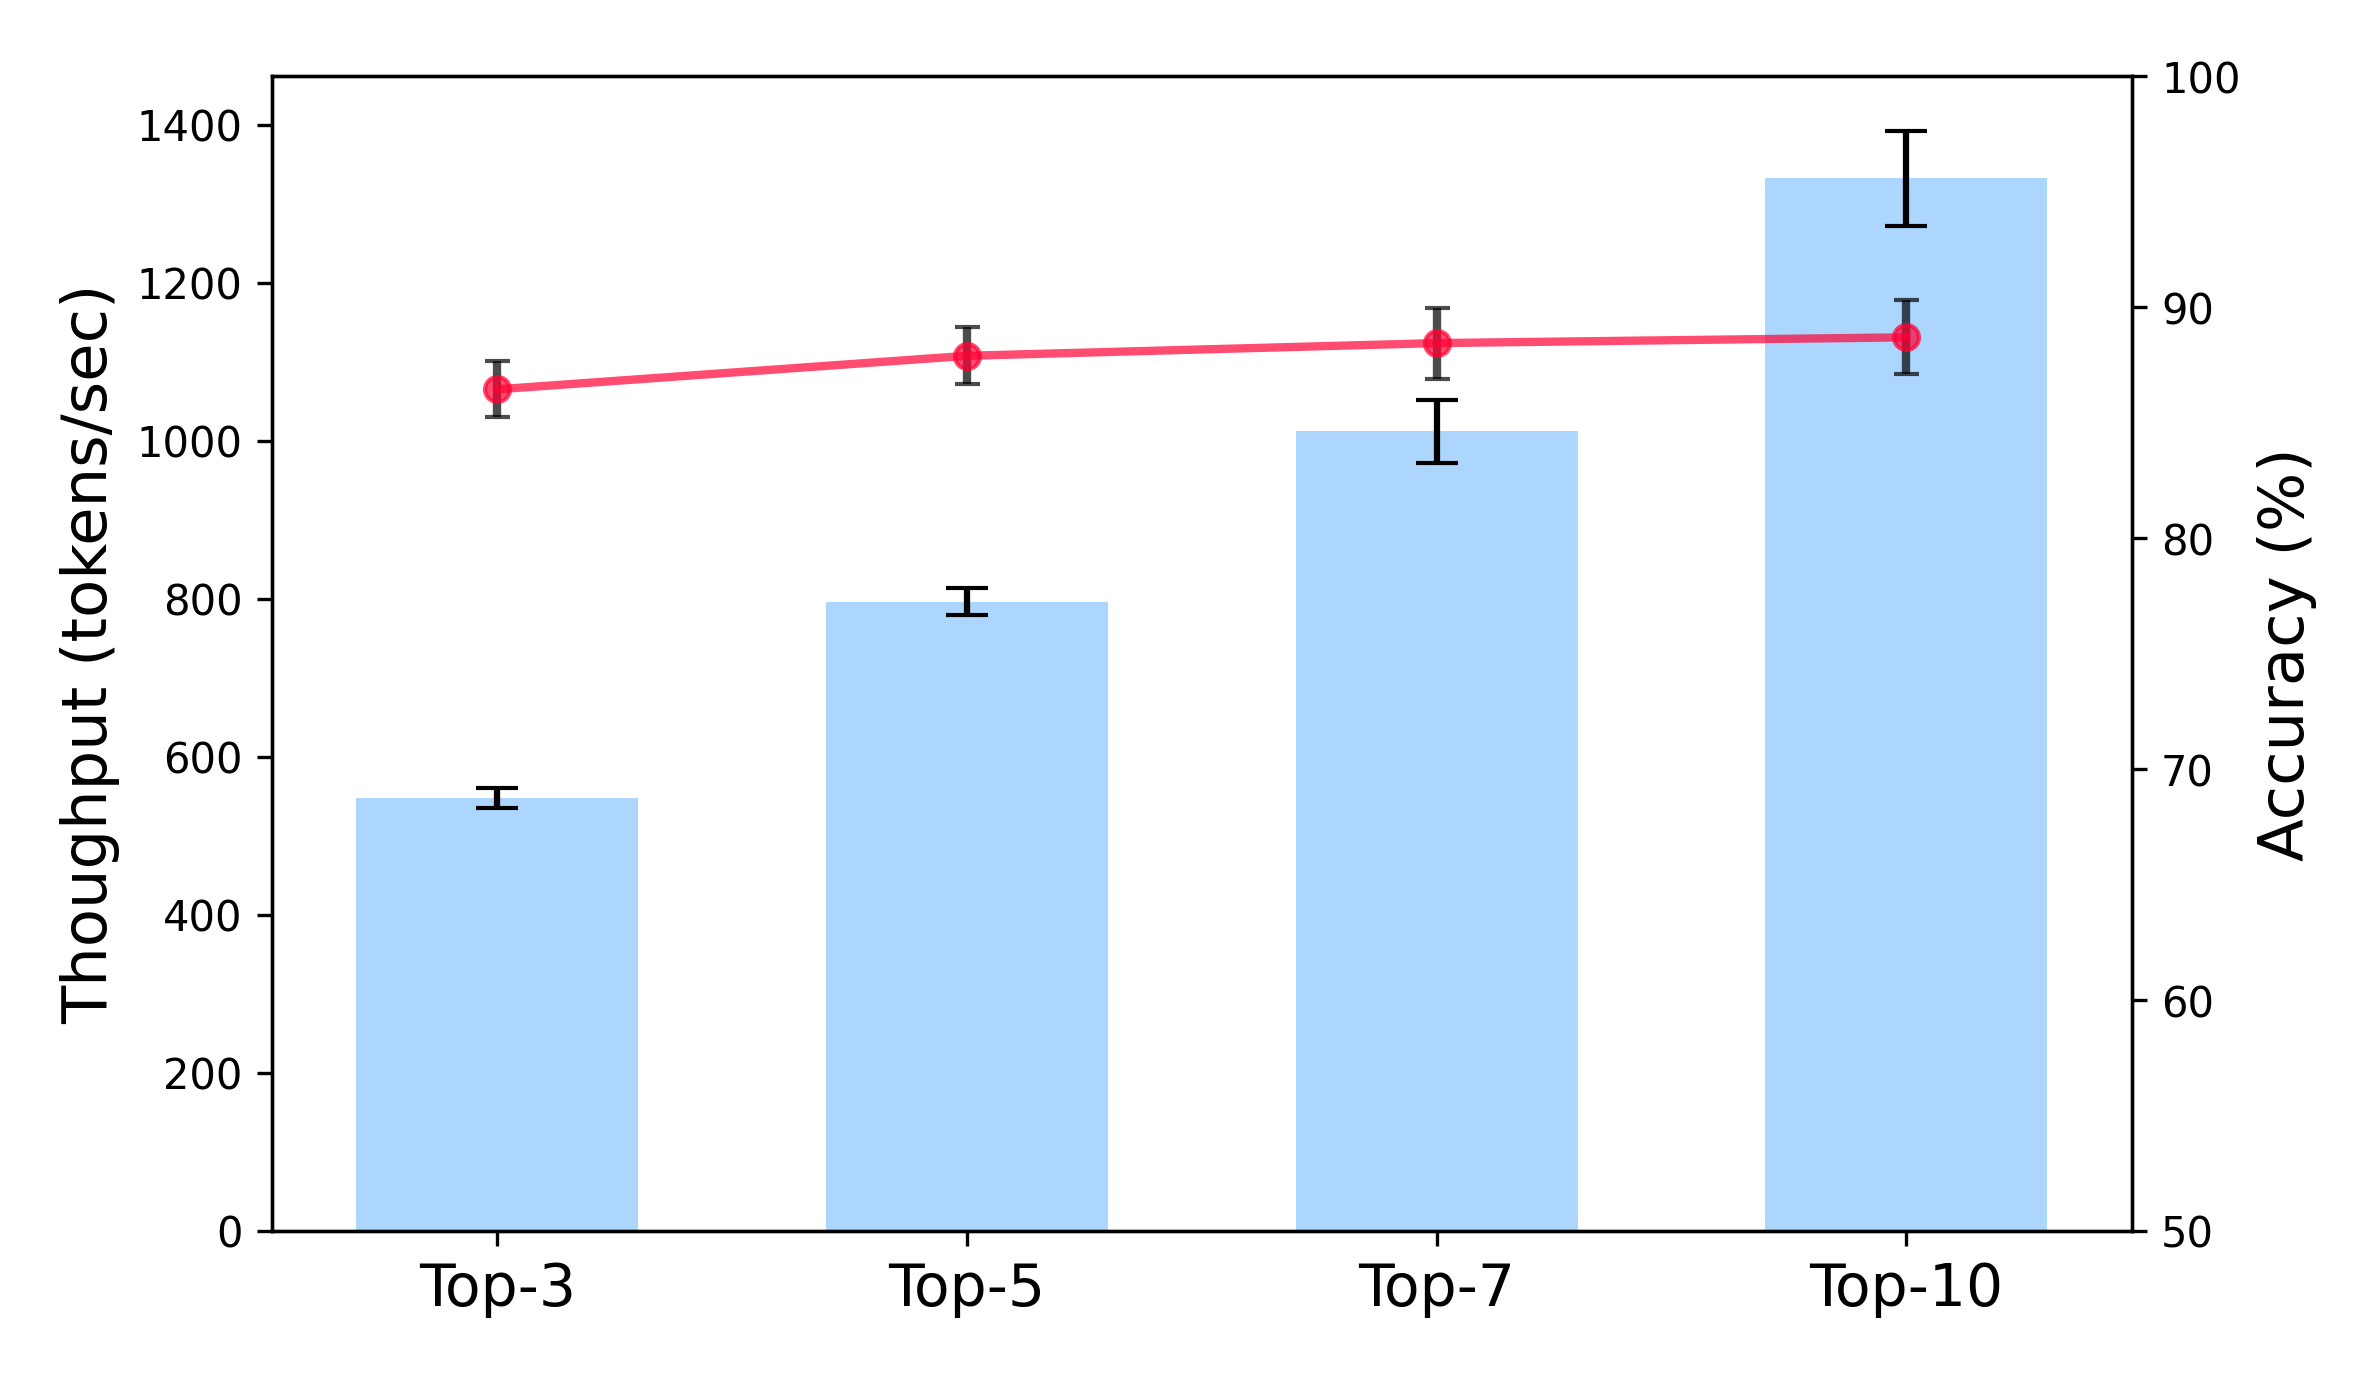
This image presents a bar chart comparing the throughput (tokens/second) and accuracy (%) of a system for different values of 'Top-k'. The chart displays throughput as blue bars and accuracy as red data points with error bars. The x-axis represents the Top-k values (3, 5, 7, and 10).
### Components/Axes
* **X-axis:** "Top-k" with markers at 3, 5, 7, and 10.
* **Left Y-axis:** "Throughput (tokens/sec)" ranging from 0 to 1400.
* **Right Y-axis:** "Accuracy (%)" ranging from 50 to 100.
* **Data Series 1:** Throughput - Represented by blue bars.
* **Data Series 2:** Accuracy - Represented by red data points with error bars.
* **Legend:** No explicit legend, but the color coding is clear (blue for throughput, red for accuracy).
### Detailed Analysis
The chart shows the following data points:
* **Top-3:**
* Throughput: Approximately 550 tokens/sec.
* Accuracy: Approximately 87% with an error bar extending from roughly 84% to 90%.
* **Top-5:**
* Throughput: Approximately 750 tokens/sec.
* Accuracy: Approximately 88% with an error bar extending from roughly 85% to 91%.
* **Top-7:**
* Throughput: Approximately 1000 tokens/sec.
* Accuracy: Approximately 92% with an error bar extending from roughly 89% to 95%.
* **Top-10:**
* Throughput: Approximately 1300 tokens/sec.
* Accuracy: Approximately 91% with an error bar extending from roughly 88% to 94%.
**Trends:**
* The throughput generally increases as the Top-k value increases. The increase is most significant between Top-5 and Top-7.
* The accuracy initially increases from Top-3 to Top-7, then slightly decreases at Top-10, but remains within the error bounds of Top-7.
* The accuracy line is relatively flat, indicating that increasing Top-k doesn't drastically improve accuracy, but does increase throughput.
### Key Observations
* There's a clear trade-off between throughput and accuracy. Higher throughput is achieved with larger Top-k values, but accuracy plateaus and slightly decreases.
* The error bars on the accuracy data suggest that the variations in accuracy are relatively small, and the observed differences might not be statistically significant.
* The largest jump in throughput occurs between Top-5 and Top-7.
### Interpretation
The data suggests that increasing the 'Top-k' parameter improves the throughput of the system, allowing it to process more tokens per second. However, this improvement comes at the cost of a slight decrease in accuracy. The optimal Top-k value depends on the specific application and the relative importance of throughput versus accuracy.
The relatively flat accuracy curve indicates that beyond a certain point (around Top-7 in this case), increasing Top-k provides diminishing returns in terms of accuracy. The system appears to reach a point where adding more candidate options doesn't significantly improve the quality of the output.
The error bars are important to consider. The overlap between the error bars at Top-7 and Top-10 suggests that the difference in accuracy between these two values is not statistically significant. Therefore, choosing Top-10 might be a reasonable compromise if maximizing throughput is the primary goal.
This chart likely represents the performance of a language model or a similar system where 'Top-k' refers to the number of most likely tokens considered at each step of the generation process. A higher Top-k value allows for more diverse outputs but may also introduce more errors.