## Bar Chart: Throughput vs Accuracy Across Top-k Categories
### Overview
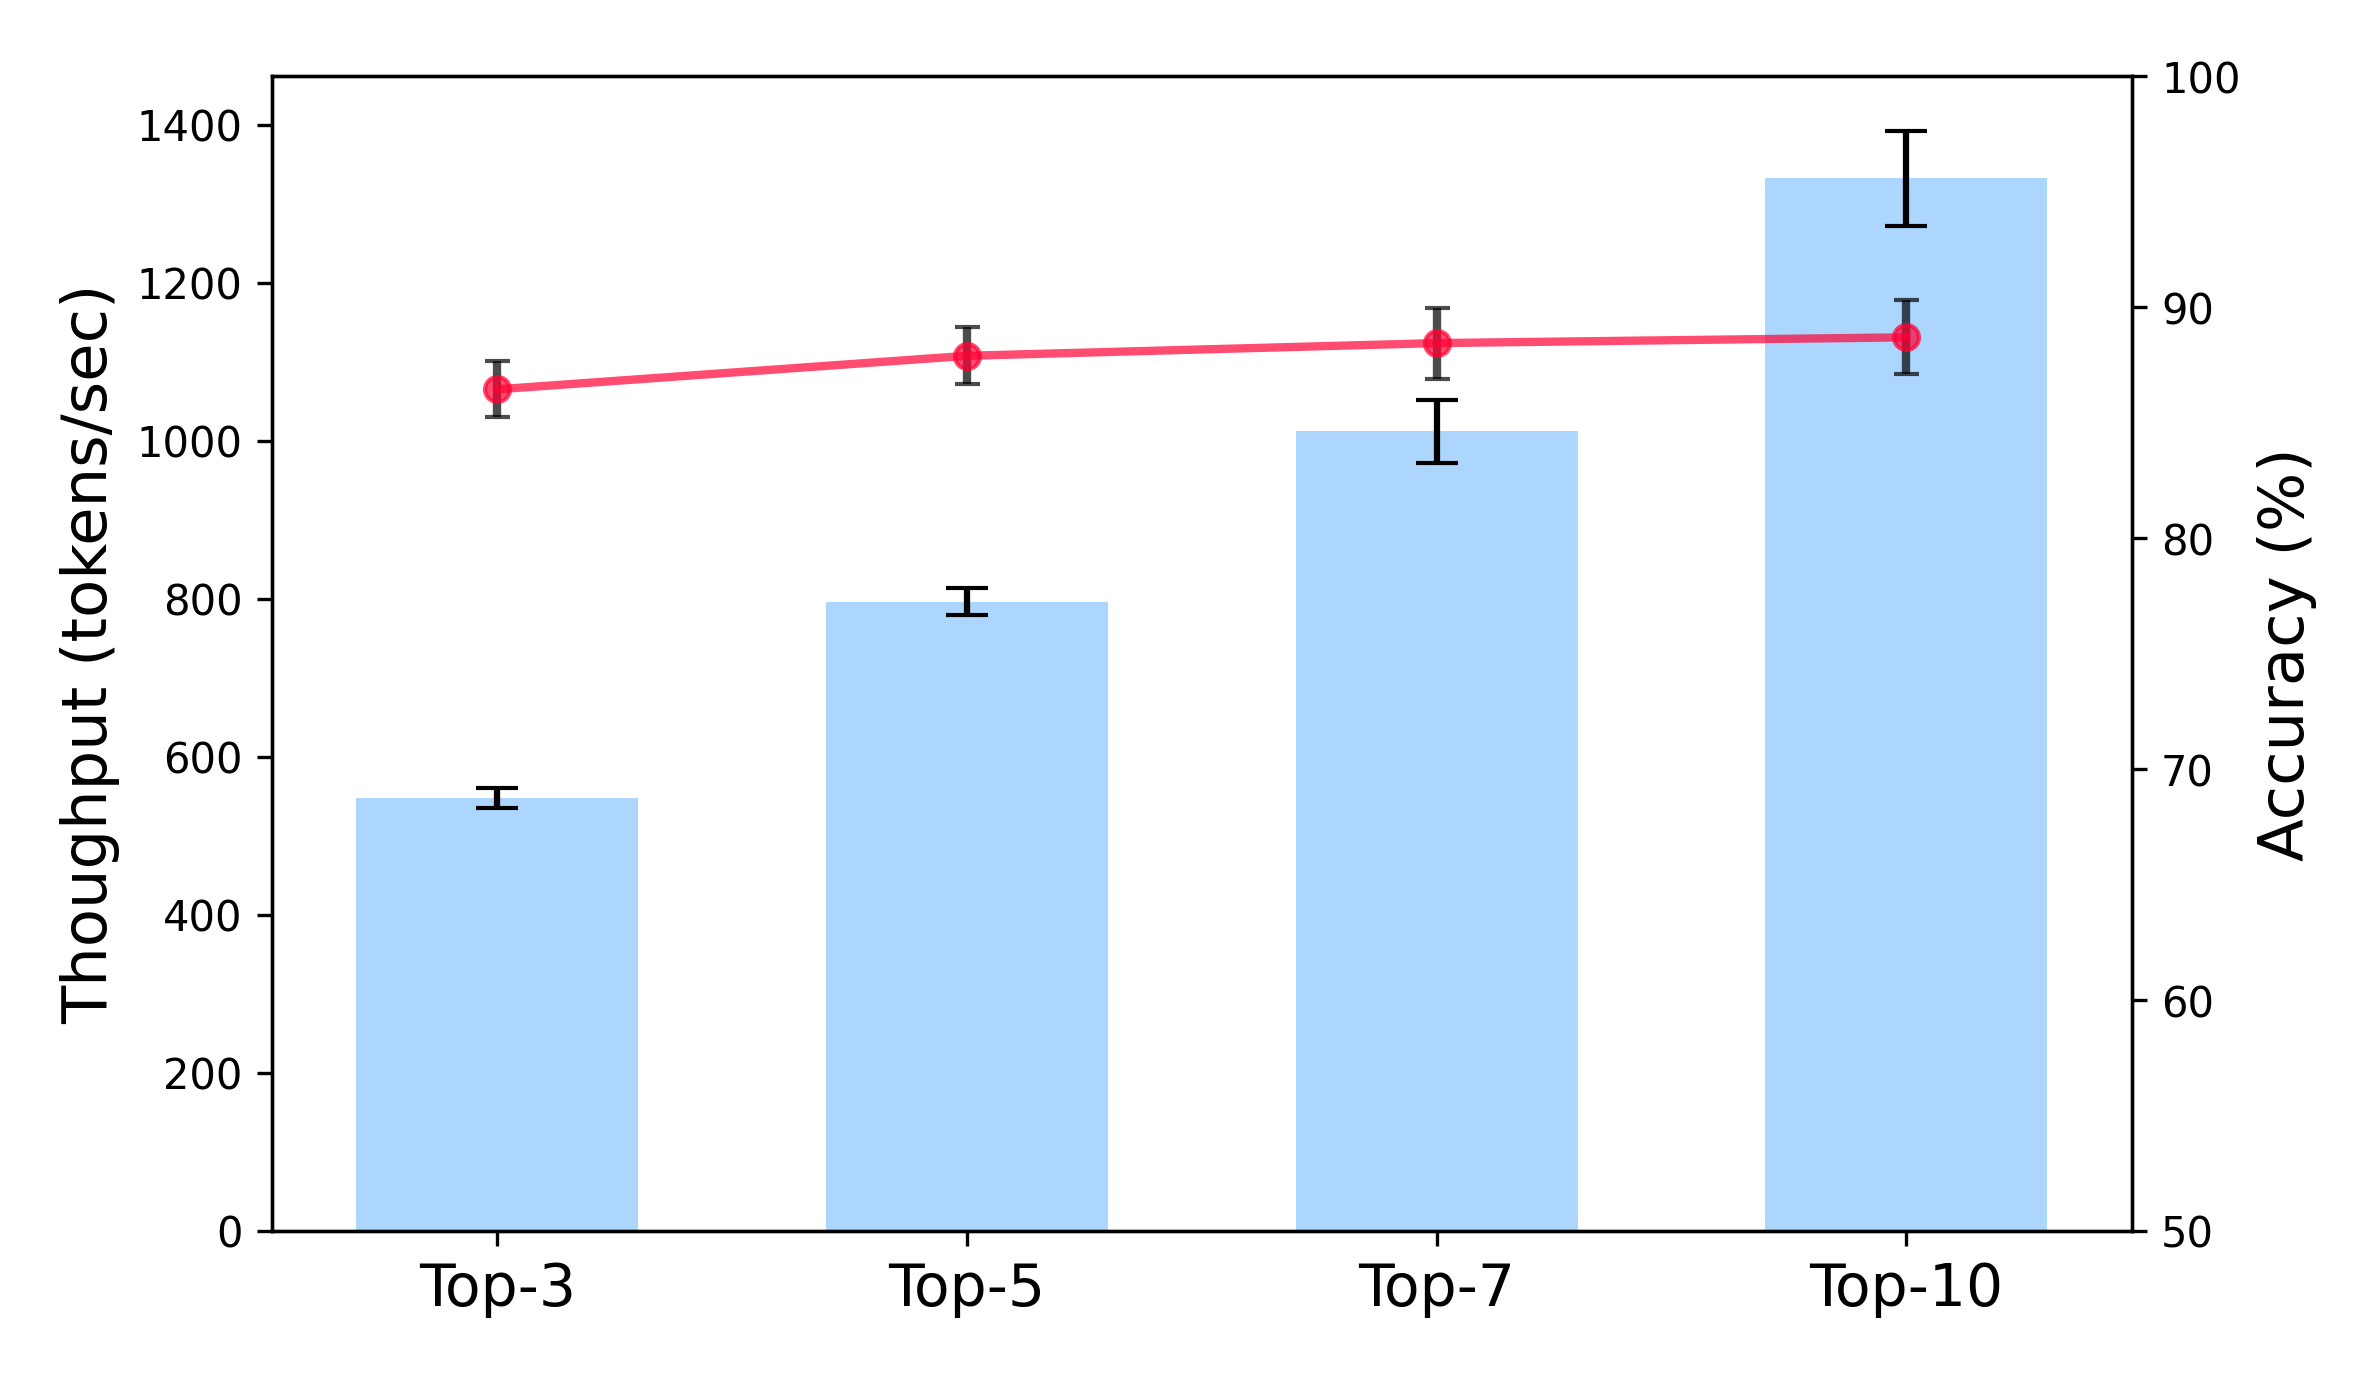
The chart compares two metrics—**throughput (tokens/sec)** and **accuracy (%)**—across four categories: **Top-3**, **Top-5**, **Top-7**, and **Top-10**. Throughput is represented by blue bars on the left y-axis, while accuracy is shown as a red line on the right y-axis. Both metrics exhibit upward trends as the category increases from Top-3 to Top-10.
---
### Components/Axes
- **X-axis**: Categories labeled **Top-3**, **Top-5**, **Top-7**, **Top-10** (left to right).
- **Left Y-axis**: **Throughput (tokens/sec)**, scaled from 0 to 1400.
- **Right Y-axis**: **Accuracy (%)**, scaled from 50% to 100%.
- **Legend**: Located on the right side of the chart.
- **Red line**: Accuracy (%)
- **Blue bars**: Throughput (tokens/sec)
---
### Detailed Analysis
#### Throughput (Blue Bars)
- **Top-3**: ~550 tokens/sec (error bar: ±~50 tokens/sec).
- **Top-5**: ~800 tokens/sec (error bar: ±~50 tokens/sec).
- **Top-7**: ~1000 tokens/sec (error bar: ±~100 tokens/sec).
- **Top-10**: ~1300 tokens/sec (error bar: ±~100 tokens/sec).
#### Accuracy (Red Line)
- **Top-3**: ~92% (error bar: ±~2%).
- **Top-5**: ~94% (error bar: ±~2%).
- **Top-7**: ~95% (error bar: ±~2%).
- **Top-10**: ~96% (error bar: ±~2%).
---
### Key Observations
1. **Throughput increases linearly** with the category, doubling from Top-3 to Top-10.
2. **Accuracy improves gradually**, rising from 92% to 96% across categories.
3. **Error bars** indicate moderate variability in throughput (larger for Top-7 and Top-10) and minimal uncertainty in accuracy.
4. **Divergence in scales**: Throughput values are 10–20x larger than accuracy percentages, but both trends align in direction.
---
### Interpretation
The data suggests a **positive correlation** between the number of top elements considered (Top-k) and both throughput and accuracy. This implies that:
- **Increasing Top-k** enhances system performance in terms of processing speed (throughput) and correctness (accuracy).
- The **error bars** for throughput grow with Top-k, indicating potential trade-offs in stability or resource usage at higher Top-k values.
- The **accuracy trend** is relatively stable, suggesting robustness in model predictions even as Top-k increases.
This could reflect a scenario where expanding the scope of top elements (e.g., in recommendation systems or search algorithms) improves both efficiency and reliability, though with diminishing returns in accuracy gains.