\n
## Chart: Per-Period and Per-Action Regret vs. Time/Actions
### Overview
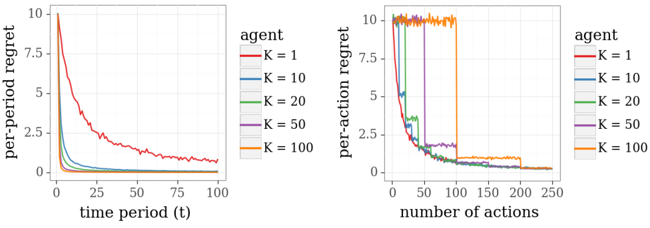
The image presents two line charts comparing the regret of an agent under different values of 'K' (1, 10, 20, 50, 100). The left chart shows per-period regret against time period (t), while the right chart shows per-action regret against the number of actions. Both charts share the same color scheme for each 'K' value.
### Components/Axes
* **Left Chart:**
* X-axis: "time period (t)" ranging from 0 to 100.
* Y-axis: "per-period regret" ranging from 0 to 10.
* Legend (top-right): "agent" with labels:
* K = 1 (Red)
* K = 10 (Blue)
* K = 20 (Green)
* K = 50 (Light Blue)
* K = 100 (Orange)
* **Right Chart:**
* X-axis: "number of actions" ranging from 0 to 250.
* Y-axis: "per-action regret" ranging from 0 to 10.
* Legend (top-right): "agent" with labels:
* K = 1 (Red)
* K = 10 (Blue)
* K = 20 (Green)
* K = 50 (Light Blue)
* K = 100 (Orange)
### Detailed Analysis or Content Details
**Left Chart (Per-Period Regret vs. Time Period):**
* **K = 1 (Red):** The line starts at approximately 9.5 and decreases rapidly to around 3.0 by t=25, then continues to decrease more slowly, reaching approximately 1.5 at t=100.
* **K = 10 (Blue):** The line starts at approximately 9.5 and decreases very rapidly to near 0 by t=10, and remains close to 0 for the rest of the time period.
* **K = 20 (Green):** The line starts at approximately 9.5 and decreases rapidly to near 0 by t=15, and remains close to 0 for the rest of the time period.
* **K = 50 (Light Blue):** The line starts at approximately 9.5 and decreases rapidly to near 0 by t=20, and remains close to 0 for the rest of the time period.
* **K = 100 (Orange):** The line starts at approximately 9.5 and decreases rapidly to around 1.0 by t=25, then continues to decrease more slowly, reaching approximately 0.5 at t=100.
**Right Chart (Per-Action Regret vs. Number of Actions):**
* **K = 1 (Red):** The line starts at approximately 9.5 and decreases rapidly to around 2.5 by 50 actions, then fluctuates between 0.5 and 2.5 for the remainder of the actions, ending around 1.0 at 250 actions.
* **K = 10 (Blue):** The line starts at approximately 9.5 and decreases very rapidly to near 0 by 50 actions, and remains close to 0 for the rest of the actions.
* **K = 20 (Green):** The line starts at approximately 9.5 and decreases very rapidly to near 0 by 50 actions, and remains close to 0 for the rest of the actions.
* **K = 50 (Light Blue):** The line starts at approximately 9.5 and decreases very rapidly to near 0 by 50 actions, and remains close to 0 for the rest of the actions.
* **K = 100 (Orange):** The line starts at approximately 9.5 and decreases rapidly to around 1.0 by 50 actions, then fluctuates between 0 and 1.0 for the remainder of the actions, ending around 0.5 at 250 actions.
### Key Observations
* All lines start with a high regret value (approximately 9.5).
* As 'K' increases, the regret decreases more rapidly and stabilizes closer to 0.
* The per-period regret (left chart) generally decreases and plateaus faster than the per-action regret (right chart).
* K=1 exhibits the highest and most persistent regret in both charts.
* K=10, K=20, and K=50 show very similar behavior, with regret dropping to near zero quickly.
* K=100 shows a slower decrease in regret compared to K=10, K=20, and K=50, but still significantly lower than K=1.
### Interpretation
The data suggests that increasing the value of 'K' leads to a reduction in both per-period and per-action regret. This indicates that the agent learns more effectively and makes better decisions as 'K' increases. The rapid decrease in regret for K=10, 20, and 50 suggests a point of diminishing returns, where further increases in 'K' do not significantly improve performance. The persistent regret observed for K=1 implies that the agent struggles to learn effectively with a small value of 'K'.
The difference between the two charts highlights the impact of time versus the number of actions. Per-period regret decreases more quickly, suggesting that the agent improves its decision-making within each time step. However, per-action regret takes longer to converge, indicating that the cumulative effect of actions still contributes to regret even after the agent has learned to make better decisions in each period. The fluctuations in the per-action regret for K=1 suggest that the agent continues to experience occasional suboptimal actions even after a large number of trials.