## Vector Field Diagram: Radial Flow
### Overview
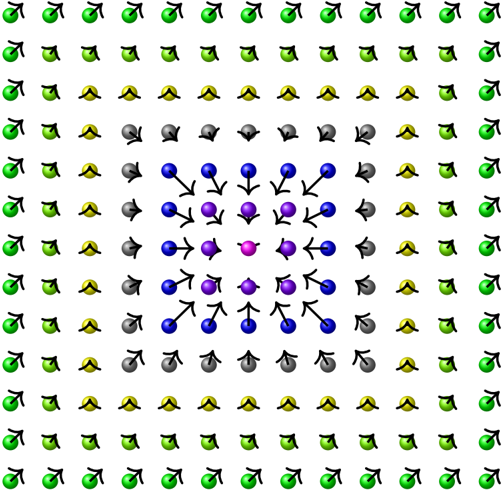
The image depicts a 2D vector field on a grid. Each grid point has a colored sphere and an arrow indicating the direction and, qualitatively, the magnitude of the vector at that point. The color of the sphere changes radially from the center, with the colors transitioning from pink at the center, to purple, blue, gray, yellow, and finally green at the edges. The arrows generally point away from the center, indicating a radial flow.
### Components/Axes
* **Grid:** A 11x11 grid of points.
* **Vectors:** Each point has an associated vector represented by an arrow.
* **Color Gradient:** The color of the sphere at each point varies radially from the center. The colors are:
* Pink (center)
* Purple
* Blue
* Gray
* Yellow
* Green (outer edges)
* **Arrow Direction:** The arrows generally point radially outward from the center.
### Detailed Analysis
* **Center:** The central point is pink. The arrow at the center is short and points in a random direction.
* **Purple Region:** The points immediately surrounding the center are purple. The arrows point outwards from the center.
* **Blue Region:** The next layer of points is blue. The arrows point outwards from the center.
* **Gray Region:** The next layer of points is gray. The arrows point outwards from the center.
* **Yellow Region:** The next layer of points is yellow. The arrows point outwards from the center.
* **Green Region:** The outermost points are green. The arrows point outwards from the center.
* **Arrow Length:** The length of the arrows appears to increase as the distance from the center increases, suggesting that the magnitude of the vector field increases with distance from the center.
### Key Observations
* The vector field is approximately radially symmetric.
* The magnitude of the vector field increases with distance from the center.
* The color gradient provides a visual representation of the distance from the center.
### Interpretation
The diagram likely represents a physical phenomenon where something is emanating from a central point. The color gradient could represent a scalar field (e.g., temperature, pressure, concentration) that decreases with distance from the center. The arrows represent the direction and magnitude of a vector field (e.g., velocity, force) that is driven by the scalar field. The diagram could be used to visualize fluid flow, heat transfer, or diffusion processes.