## Line Chart: Accuracy vs. Logical Coherence Trade-off (10-Axiom)
### Overview
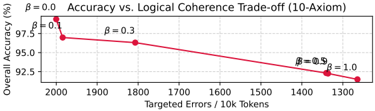
This image displays a line chart illustrating the trade-off between "Overall Accuracy (%)" and "Targeted Errors / 10k Tokens" across five distinct data points, each associated with a specific $\beta$ value. The chart demonstrates that as the number of targeted errors is reduced (moving from left to right on the X-axis), the overall accuracy of the system also decreases.
### Components/Axes
* **Title:** "Accuracy vs. Logical Coherence Trade-off (10-Axiom)" located at the top center.
* **Y-Axis:** Labeled "Overall Accuracy (%)". The scale ranges from 92.5 to 97.5, with grid lines at 92.5, 95.0, and 97.5.
* **X-Axis:** Labeled "Targeted Errors / 10k Tokens". The scale is inverted (descending from left to right), ranging from 2000 down to 1250. Grid lines are present at 100-unit intervals.
* **Data Series:** A single red line connecting five data points. Each point is marked with a red circle and labeled with a corresponding $\beta$ value.
### Detailed Analysis
The data points, moving from left to right (decreasing targeted errors), are as follows:
1. **Point 1 ($\beta = 0.0$):**
* **Position:** Top-left.
* **X-Value (Targeted Errors):** $\approx$ 1990
* **Y-Value (Accuracy):** $\approx$ 99.0%
* **Trend:** This is the highest accuracy and highest error count point.
2. **Point 2 ($\beta = 0.1$):**
* **Position:** Left-center.
* **X-Value (Targeted Errors):** $\approx$ 1980
* **Y-Value (Accuracy):** $\approx$ 97.0%
* **Trend:** A sharp drop in accuracy occurs between $\beta=0.0$ and $\beta=0.1$ despite a very small reduction in targeted errors.
3. **Point 3 ($\beta = 0.3$):**
* **Position:** Center-left.
* **X-Value (Targeted Errors):** $\approx$ 1800
* **Y-Value (Accuracy):** $\approx$ 96.3%
* **Trend:** The slope flattens significantly compared to the previous segment.
4. **Point 4 ($\beta = 0.9$):**
* **Position:** Center-right.
* **X-Value (Targeted Errors):** $\approx$ 1340
* **Y-Value (Accuracy):** $\approx$ 92.3%
* **Trend:** A long, gradual decline in accuracy as targeted errors are reduced from 1800 to 1340.
5. **Point 5 ($\beta = 1.0$):**
* **Position:** Bottom-right.
* **X-Value (Targeted Errors):** $\approx$ 1260
* **Y-Value (Accuracy):** $\approx$ 91.5%
* **Trend:** This represents the lowest accuracy and lowest error count point.
### Key Observations
* **Inverted X-Axis:** The X-axis is oriented such that higher values are on the left and lower values are on the right. This visualizes the "reduction" of errors as a movement to the right.
* **Non-Linear Decay:** The relationship is not strictly linear. The most significant "cost" to accuracy occurs at the very beginning of the intervention ($\beta=0.0$ to $\beta=0.1$).
* **Trade-off:** There is a clear, positive correlation between "Targeted Errors" and "Overall Accuracy." Attempting to force the system to have fewer errors (higher $\beta$) results in a degradation of overall performance.
### Interpretation
This chart depicts a classic Pareto frontier or trade-off curve in machine learning or logical reasoning systems. The $\beta$ parameter likely represents a constraint or regularization strength applied to the model to enforce logical coherence (reducing "Targeted Errors").
The data suggests that the model is highly optimized for accuracy when constraints are loose ($\beta=0.0$). As constraints are tightened to improve logical coherence (increasing $\beta$ toward 1.0), the model's ability to maintain its overall accuracy diminishes. The steep initial drop suggests that the first few constraints applied to the model are the most "expensive" in terms of accuracy, while subsequent constraints have a more gradual, linear impact on performance. This implies that the model's "natural" state is highly accurate but logically flawed, and forcing logical coherence requires a significant sacrifice in performance.