## Line Chart: Benchmark: AIME24
### Overview
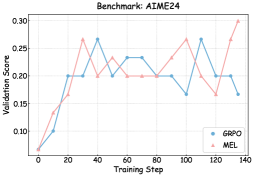
The image displays a line chart titled "Benchmark: AIME24," comparing the validation score performance of two methods, GAPO and MEL, over the course of 140 training steps. The chart shows the fluctuating performance of both methods, with MEL achieving the highest final score.
### Components/Axes
* **Chart Title:** "Benchmark: AIME24" (centered at the top).
* **Y-Axis:** Labeled "Validation Score." The scale runs from 0.10 to 0.30, with major tick marks at 0.10, 0.15, 0.20, 0.25, and 0.30.
* **X-Axis:** Labeled "Training Step." The scale runs from 0 to 140, with major tick marks at intervals of 20 (0, 20, 40, 60, 80, 100, 120, 140).
* **Legend:** Located in the bottom-right corner of the plot area.
* A blue line with a circular marker is labeled "GAPO".
* A red line with a circular marker is labeled "MEL".
### Detailed Analysis
**Data Series: GAPO (Blue Line)**
* **Trend:** The line shows significant volatility, with two distinct peaks and a notable dip in the middle.
* **Approximate Data Points:**
* Step 0: ~0.05
* Step 20: ~0.15
* Step 40: ~0.27 (First Peak)
* Step 60: ~0.20
* Step 80: ~0.24
* Step 100: ~0.16 (Significant Dip)
* Step 120: ~0.27 (Second Peak)
* Step 140: ~0.20
**Data Series: MEL (Red Line)**
* **Trend:** The line shows an overall upward trend with several fluctuations, culminating in a sharp increase to its highest point at the final step.
* **Approximate Data Points:**
* Step 0: ~0.05
* Step 20: ~0.13
* Step 30: ~0.27 (Early Peak)
* Step 40: ~0.20
* Step 50: ~0.24
* Step 60: ~0.20
* Step 80: ~0.20
* Step 100: ~0.27
* Step 110: ~0.16
* Step 140: ~0.30 (Final and Highest Peak)
### Key Observations
1. **Final Performance:** At the final recorded step (140), MEL (red) achieves the highest validation score on the chart (~0.30), significantly outperforming GAPO (blue, ~0.20).
2. **Volatility:** Both methods exhibit considerable volatility, with scores rising and falling sharply between measurement points. Neither shows a smooth, monotonic improvement.
3. **Peak Timing:** GAPO's peaks occur at steps 40 and 120. MEL's peaks occur at steps 30, 100, and 140.
4. **Convergence and Divergence:** The lines cross multiple times (e.g., near steps 10, 50, 70, 90, 110), indicating periods where one method temporarily outperforms the other before the advantage shifts.
5. **Notable Dip:** Both methods experience a significant drop in performance around step 110, with scores falling to approximately 0.16.
### Interpretation
The chart suggests that while both the GAPO and MEL methods are capable of reaching similar peak performance levels (~0.27) during training, their learning trajectories are unstable. The key differentiator is the final outcome: MEL demonstrates a capacity for a strong late-stage improvement, achieving a validation score of ~0.30 by step 140, which is the best result shown. In contrast, GAPO's performance at step 140 is middling relative to its own history.
The synchronized dip around step 110 for both methods could indicate a challenging phase in the training process, a change in data, or an inherent instability in the optimization landscape for this benchmark. The fact that MEL recovers from this dip to reach a new high suggests it may have better resilience or adaptation capabilities in the later stages of training compared to GAPO for the AIME24 task. The overall message is that final training step performance is not predictable from mid-training peaks, and method selection may depend on whether consistent mid-training performance or peak final performance is prioritized.