## Line Chart: AIME24 Benchmark Comparison
### Overview
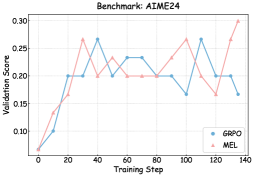
The image is a line chart comparing the validation scores of two methods, **GRPO** (blue line) and **MEL** (red line), across 140 training steps. The chart shows fluctuating performance trends for both methods, with GRPO exhibiting sharper peaks and valleys, while MEL demonstrates more gradual changes.
### Components/Axes
- **X-axis (Training Step)**: Ranges from 0 to 140 in increments of 20.
- **Y-axis (Validation Score)**: Ranges from 0.05 to 0.30 in increments of 0.05.
- **Legend**: Located in the bottom-right corner, with:
- **Blue line**: Labeled "GRPO"
- **Red line**: Labeled "MEL"
### Detailed Analysis
#### GRPO (Blue Line)
- **Initial Trend**: Starts at ~0.05 (step 0), rises sharply to ~0.20 by step 20.
- **Peaks**:
- Step 20: ~0.20
- Step 40: ~0.27
- Step 110: ~0.27
- **Valleys**:
- Step 0: ~0.05
- Step 10: ~0.10
- Step 100: ~0.17
- Step 140: ~0.17
- **Final Value**: Ends at ~0.17 (step 140).
#### MEL (Red Line)
- **Initial Trend**: Starts at ~0.05 (step 0), rises to ~0.13 by step 10.
- **Peaks**:
- Step 30: ~0.27
- Step 100: ~0.27
- Step 140: ~0.30
- **Valleys**:
- Step 0: ~0.05
- Step 10: ~0.13
- Step 120: ~0.17
- **Final Value**: Ends at ~0.30 (step 140).
### Key Observations
1. **Divergence in Performance**: MEL outperforms GRPO in the final training step (0.30 vs. 0.17).
2. **Volatility**: GRPO shows more pronounced fluctuations (e.g., sharp drops at steps 100 and 140).
3. **Stability**: MEL maintains a steadier upward trend after step 100.
4. **Early Similarity**: Both methods start with similar low scores but diverge after step 40.
### Interpretation
The chart suggests that **MEL achieves higher validation scores in later training stages**, potentially indicating better long-term optimization or robustness. GRPO’s volatility might reflect overfitting or instability in later phases. The final score gap (0.30 vs. 0.17) highlights MEL’s superiority in this benchmark. The legend’s placement and color coding (blue for GRPO, red for MEL) are consistent with the line placements, confirming accurate data representation.