\n
## Diagram: Acute Coronary Syndrome (ACS) Diagnostic Pathway
### Overview
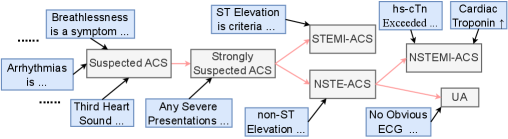
The image depicts a flowchart illustrating a diagnostic pathway for Acute Coronary Syndrome (ACS). It outlines the progression from initial symptoms and findings to various ACS classifications based on diagnostic criteria. The diagram uses rectangular boxes to represent diagnostic states and arrows to indicate the flow of assessment and diagnosis.
### Components/Axes
The diagram consists of interconnected boxes representing clinical findings and diagnoses. The connections are indicated by arrows, with some arrows being thicker and colored red, potentially indicating a stronger association or more direct pathway. The boxes contain text labels describing the clinical state or diagnosis. There are no explicit axes or scales in this diagram.
### Detailed Analysis or Content Details
The diagram can be broken down into the following flow:
1. **Initial Presentations:**
* "Breathlessness is a symptom..." leads to "Suspected ACS".
* "Arrhythmias is..." leads to "Suspected ACS".
* "Third Heart Sound..." leads to "Suspected ACS".
* "Any Severe Presentations..." leads to "Strongly Suspected ACS".
2. **Suspected ACS Progression:**
* "Suspected ACS" leads to "Strongly Suspected ACS".
* "Strongly Suspected ACS" branches into:
* "ST Elevation is criteria..." leading to "STEMI-ACS".
* "non-ST Elevation..." leading to "NSTE-ACS".
3. **Further Diagnostic Steps & Classifications:**
* "STEMI-ACS" leads to "hs-cTn Exceeded..." which then leads to "Cardiac Troponin".
* "NSTE-ACS" branches into:
* "No Obvious ECG" leading to "UA".
* Directly to "NSTEMI-ACS".
**Text within Boxes (transcribed):**
* Breathlessness is a symptom…
* Arrhythmias is…
* Third Heart Sound…
* Any Severe Presentations…
* Suspected ACS
* Strongly Suspected ACS
* ST Elevation is criteria…
* non-ST Elevation…
* NSTE-ACS
* NSTEMI-ACS
* UA
* No Obvious ECG
* hs-cTn Exceeded…
* Cardiac Troponin
* STEMI-ACS
### Key Observations
The diagram highlights the importance of ST-segment elevation as a key differentiator in ACS diagnosis, leading directly to STEMI-ACS. The pathway for NSTE-ACS is more complex, involving evaluation of ECG findings and cardiac troponin levels to differentiate between NSTEMI-ACS and Unstable Angina (UA). The diagram suggests that breathlessness, arrhythmias, and third heart sounds are initial indicators that prompt consideration of ACS.
### Interpretation
This diagram represents a simplified clinical decision-making process for ACS. It demonstrates how initial clinical presentations are used to categorize patients into different risk strata and guide further diagnostic testing. The red arrows likely indicate a more urgent or direct pathway, suggesting that ST-elevation warrants immediate attention. The branching pathways illustrate the need for a nuanced approach to ACS diagnosis, considering both ECG findings and biomarker levels. The diagram is a visual aid for clinicians to ensure a systematic approach to evaluating patients with suspected ACS, ultimately leading to appropriate management and treatment. The diagram does not provide quantitative data, but rather a qualitative representation of the diagnostic process. It is a flow chart, not a chart with data points.