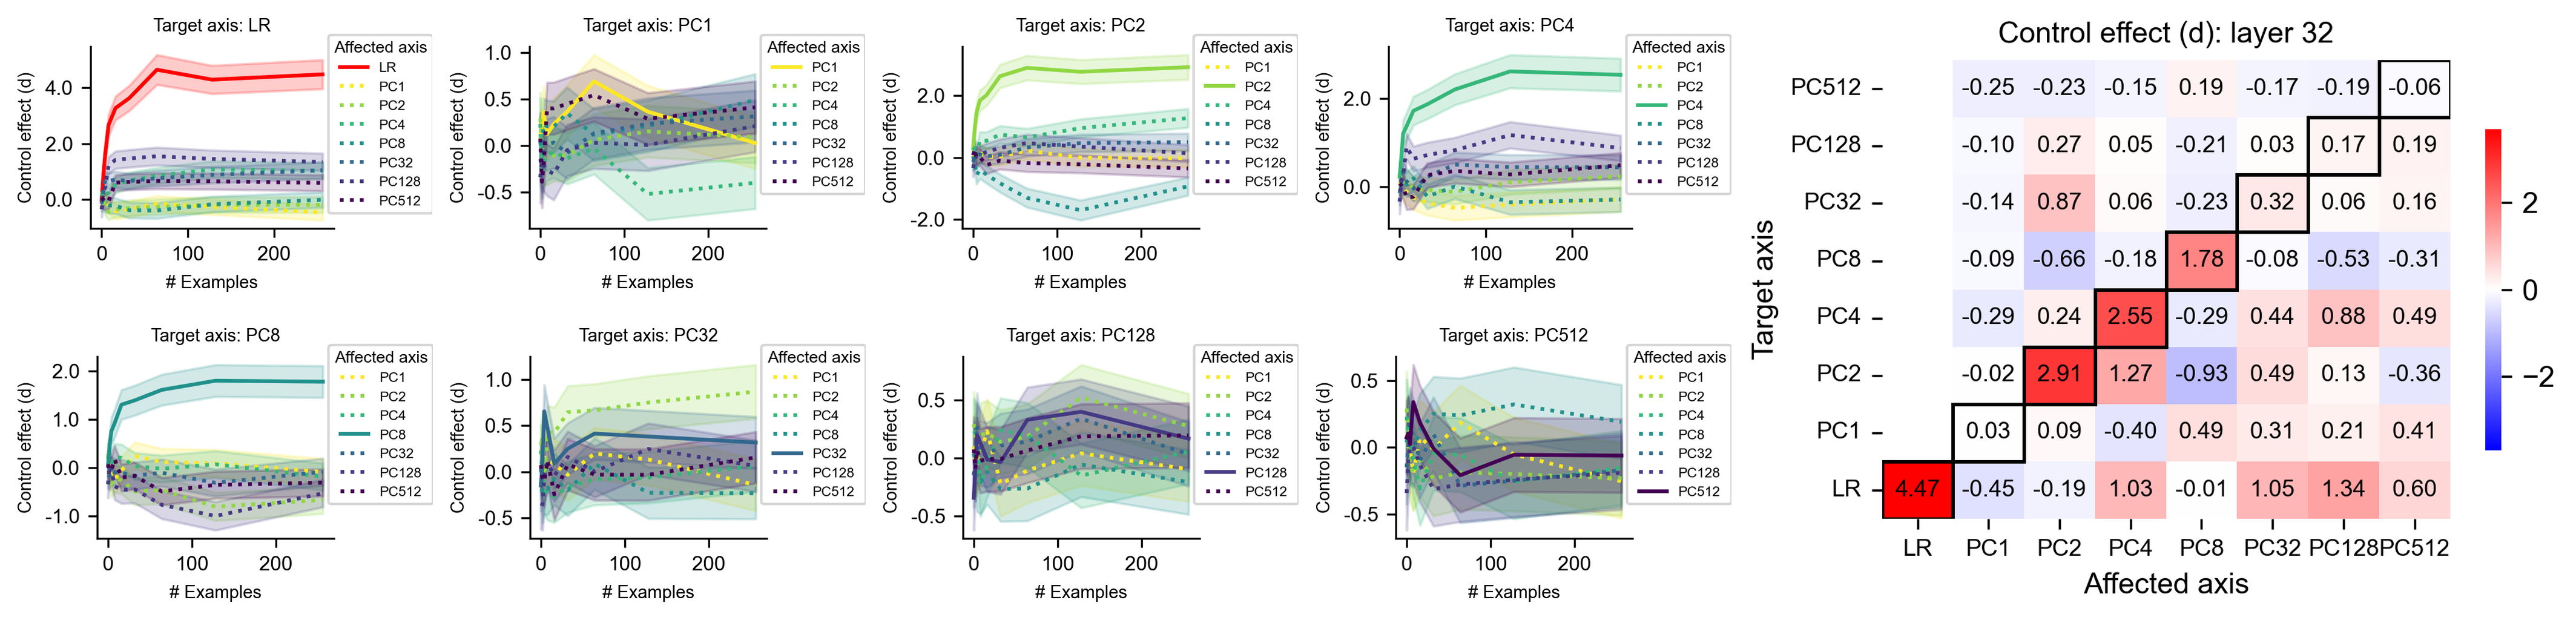
# Technical Document Extraction: Control Effect Analysis (Layer 32)
This document provides a comprehensive extraction of data and trends from the provided image, which consists of eight line charts and one summary heatmap. The data explores the "Control effect (d)" across various "Target axes" relative to "Affected axes" over a number of examples.
---
## 1. Component Isolation
The image is segmented into two primary regions:
* **Region A (Left/Center):** A grid of 8 line charts showing the progression of control effects as the number of examples increases (0 to 250).
* **Region B (Right):** A summary heatmap titled "Control effect (d): layer 32" showing the final or peak relationship between Target and Affected axes.
---
## 2. Region A: Line Chart Grid Analysis
Each chart represents a specific **Target axis**. The x-axis is **# Examples** (0, 100, 200) and the y-axis is **Control effect (d)**.
### Common Legend (Affected axis)
The following categories are used across the line charts:
* **LR:** Solid Red line.
* **PC1:** Dotted Yellow line.
* **PC2:** Solid Light Green line.
* **PC4:** Solid Teal line.
* **PC8:** Solid Dark Teal line.
* **PC32:** Solid Blue-Grey line.
* **PC128:** Solid Purple line.
* **PC512:** Dotted Dark Purple line.
### Individual Chart Trends
| Target Axis | Primary Trend (Self-Influence) | Secondary Trends (Cross-Influence) |
| :--- | :--- | :--- |
| **LR** | **LR (Red)**: Sharp upward slope, stabilizing at ~4.5. | Most other PCs cluster near 0.0 to 1.0. |
| **PC1** | **PC1 (Yellow)**: Slopes upward to ~0.5, then declines toward 0.0. | High variance; PC512 (Dotted Purple) shows a slight upward trend. |
| **PC2** | **PC2 (Light Green)**: Sharp upward slope, stabilizing at ~3.0. | PC4 (Teal) shows a slight downward trend to ~ -1.5. |
| **PC4** | **PC4 (Teal)**: Sharp upward slope, stabilizing at ~2.5. | PC128 and PC32 show slight positive trends (~0.5). |
| **PC8** | **PC8 (Dark Teal)**: Sharp upward slope, stabilizing at ~1.8. | PC2 (Light Green) shows a slight positive trend; others are near 0. |
| **PC32** | **PC32 (Blue-Grey)**: Moderate upward slope, stabilizing at ~0.4. | PC128 and PC512 track closely with PC32. |
| **PC128** | **PC128 (Purple)**: Moderate upward slope, stabilizing at ~0.3. | PC32 and PC512 show similar moderate positive trends. |
| **PC512** | **PC512 (Dotted Purple)**: Initial spike, then stabilizes near 0.0. | High noise/variance across all series in this target. |
---
## 3. Region B: Heatmap Data Extraction
**Title:** Control effect (d): layer 32
**X-Axis (Affected axis):** LR, PC1, PC2, PC4, PC8, PC32, PC128, PC512
**Y-Axis (Target axis):** LR, PC1, PC2, PC4, PC8, PC32, PC128, PC512
**Color Scale:** Blue (-2) to White (0) to Red (2+).
### Data Table (Reconstructed)
The diagonal (Target = Affected) is highlighted with bold black borders, representing the self-control effect.
| Target \ Affected | LR | PC1 | PC2 | PC4 | PC8 | PC32 | PC128 | PC512 |
| :--- | :---: | :---: | :---: | :---: | :---: | :---: | :---: | :---: |
| **PC512** | -0.25 | -0.23 | -0.15 | 0.19 | -0.17 | -0.19 | -0.06 | **-0.06** |
| **PC128** | -0.10 | 0.27 | 0.05 | -0.21 | 0.03 | 0.17 | **0.19** | 0.19 |
| **PC32** | -0.14 | 0.87 | 0.06 | -0.23 | 0.32 | **0.06** | 0.16 | 0.16 |
| **PC8** | -0.09 | -0.66 | -0.18 | 1.78 | **-0.08** | -0.53 | -0.31 | -0.31 |
| **PC4** | -0.29 | 0.24 | 2.55 | **-0.29** | 0.44 | 0.88 | 0.49 | 0.49 |
| **PC2** | -0.02 | 2.91 | **1.27** | -0.93 | 0.49 | 0.13 | -0.36 | -0.36 |
| **PC1** | 0.03 | **0.09** | -0.40 | 0.49 | 0.31 | 0.21 | 0.41 | 0.41 |
| **LR** | **4.47** | -0.45 | -0.19 | 1.03 | -0.01 | 1.05 | 1.34 | 0.60 |
---
## 4. Key Observations and Trends
1. **Diagonal Dominance (Self-Effect):** The strongest control effects are generally found on the diagonal or immediately adjacent to it. The highest single value is **4.47** (Target: LR, Affected: LR).
2. **Off-Diagonal Interactions:**
* There is a strong interaction between **Target PC2** and **Affected PC1** (2.91).
* There is a strong interaction between **Target PC4** and **Affected PC2** (2.55).
* There is a strong interaction between **Target PC8** and **Affected PC4** (1.78).
3. **Negative Effects:** Several blue cells indicate negative control effects, notably **Target PC2 / Affected PC4** (-0.93) and **Target PC8 / Affected PC1** (-0.66).
4. **Convergence:** The line charts indicate that for most axes, the control effect stabilizes after approximately 100-150 examples.
5. **Symmetry:** The matrix is not symmetric, indicating that the control effect of Axis A on Axis B is not the same as Axis B on Axis A. For example, LR on PC1 is 0.03, but PC1 on LR is -0.45.