\n
## Bar Chart: Communication Parameters Comparison
### Overview
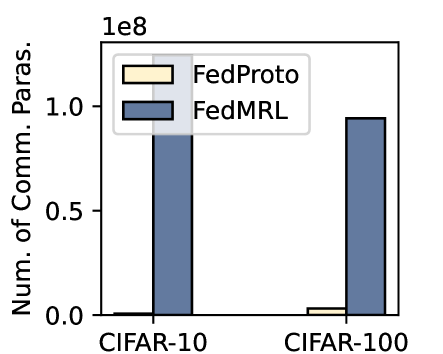
The image is a vertical bar chart comparing the number of communication parameters for two federated learning methods, FedProto and FedMRL, across two standard image classification datasets: CIFAR-10 and CIFAR-100. The chart demonstrates a significant disparity in the communication cost between the two methods.
### Components/Axes
* **Y-Axis (Vertical):**
* **Label:** "Num. of Comm. Paras." (Abbreviation for "Number of Communication Parameters").
* **Scale:** Linear scale with a multiplier of `1e8` (100 million) indicated at the top of the axis.
* **Tick Marks:** Labeled at `0.0`, `0.5`, and `1.0`. These correspond to values of 0, 50 million, and 100 million parameters, respectively.
* **X-Axis (Horizontal):**
* **Categories:** Two distinct datasets are labeled: "CIFAR-10" (left group) and "CIFAR-100" (right group).
* **Legend:**
* **Position:** Top-left corner within the chart area.
* **Items:**
* A light yellow/cream-colored box labeled "FedProto".
* A dark blue/gray-blue box labeled "FedMRL".
* **Data Series:** Two bars are plotted for each dataset category, corresponding to the two methods in the legend.
### Detailed Analysis
**Data Series & Values (Approximate):**
1. **CIFAR-10 Dataset:**
* **FedProto (Light Yellow Bar):** The bar is extremely short, visually just above the `0.0` baseline. Estimated value: **~1-5 million parameters** (0.01-0.05 on the y-axis scale).
* **FedMRL (Dark Blue Bar):** The bar is tall, extending to approximately the `1.0` mark on the y-axis. Estimated value: **~100 million parameters** (1.0 x 1e8).
2. **CIFAR-100 Dataset:**
* **FedProto (Light Yellow Bar):** The bar is slightly taller than its CIFAR-10 counterpart but remains very low. Estimated value: **~5-10 million parameters** (0.05-0.1 on the y-axis scale).
* **FedMRL (Dark Blue Bar):** The bar is very similar in height to the FedMRL bar for CIFAR-10, reaching near the `1.0` mark. Estimated value: **~95-100 million parameters** (0.95-1.0 x 1e8).
**Trend Verification:**
* **FedProto Trend:** The line of tops of the yellow bars shows a very slight upward slope from CIFAR-10 to CIFAR-100, indicating a minor increase in parameters for the more complex dataset.
* **FedMRL Trend:** The line of tops of the blue bars is nearly flat, showing almost no change in the number of communication parameters between the two datasets.
### Key Observations
1. **Massive Disparity:** The most striking observation is the orders-of-magnitude difference between FedMRL and FedProto. FedMRL's communication parameter count is approximately 20 to 100 times higher than FedProto's for both datasets.
2. **Dataset Insensitivity for FedMRL:** The communication cost for FedMRL appears largely independent of the dataset complexity (CIFAR-10 vs. CIFAR-100), as the bar heights are nearly identical.
3. **Low Baseline for FedProto:** FedProto maintains a very low communication footprint across both tasks, with only a marginal increase for the more challenging CIFAR-100 dataset.
### Interpretation
This chart provides a clear quantitative comparison of communication efficiency between two federated learning algorithms. The data strongly suggests that **FedProto is designed for or results in significantly lower communication overhead** compared to FedMRL.
* **Implication for Federated Learning:** In scenarios where communication bandwidth is a critical bottleneck (e.g., mobile or edge devices), FedProto would be the far more efficient choice. The high parameter count of FedMRL implies it may require transmitting much larger model updates or auxiliary information during the federated training rounds.
* **Relationship Between Components:** The chart isolates the "communication parameters" metric, showing that the choice of algorithm (FedProto vs. FedMRL) has a dramatically larger impact on this metric than the choice of dataset (CIFAR-10 vs. CIFAR-100). This indicates the architectural or procedural differences between the two methods are the primary driver of communication cost.
* **Anomaly/Notable Point:** The near-constant value for FedMRL across datasets is noteworthy. It suggests its communication load is tied to a fixed component (e.g., a global model size or a fixed set of prototypes) rather than scaling with the number of classes (10 vs. 100), which might be expected. FedProto's slight increase aligns more intuitively with the increased complexity of CIFAR-100.