\n
## Chart: Receiver Operating Characteristic (ROC) Curve
### Overview
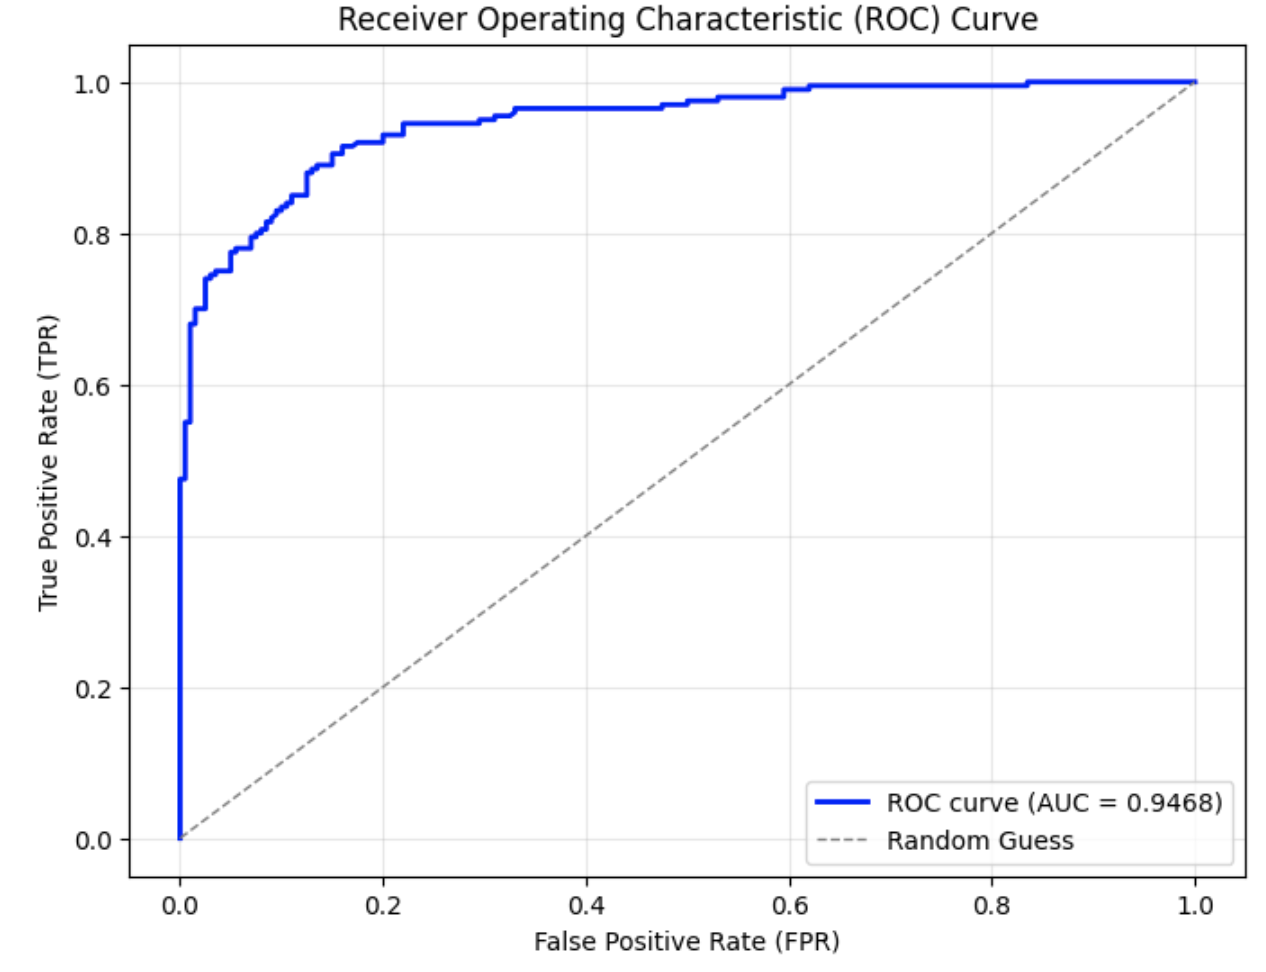
The image displays a Receiver Operating Characteristic (ROC) curve, a graphical representation of the performance of a binary classification model at all classification thresholds. It plots the True Positive Rate (TPR) against the False Positive Rate (FPR). A diagonal line represents random guessing. The area under the curve (AUC) is a measure of the model's ability to distinguish between positive and negative classes.
### Components/Axes
* **Title:** Receiver Operating Characteristic (ROC) Curve
* **X-axis:** False Positive Rate (FPR) - Scale ranges from 0.0 to 1.0 with increments of 0.2.
* **Y-axis:** True Positive Rate (TPR) - Scale ranges from 0.0 to 1.0 with increments of 0.2.
* **Legend:** Located in the bottom-right corner.
* **ROC curve (AUC = 0.9468):** Represented by a solid blue line.
* **Random Guess:** Represented by a dashed grey line.
### Detailed Analysis
The solid blue line, representing the ROC curve, starts at approximately (0.0, 0.75) and rises steeply to approximately (0.1, 0.9) before leveling off and approaching (1.0, 1.0). The curve remains consistently above the diagonal dashed grey line, indicating that the model performs better than random guessing.
Here's a breakdown of approximate data points extracted from the blue ROC curve:
* (0.0, 0.75)
* (0.05, 0.85)
* (0.1, 0.9)
* (0.2, 0.95)
* (0.3, 0.97)
* (0.4, 0.98)
* (0.5, 0.99)
* (0.6, 0.99)
* (0.7, 1.0)
* (0.8, 1.0)
* (0.9, 1.0)
* (1.0, 1.0)
The dashed grey line, representing random guessing, is a diagonal line from (0.0, 0.0) to (1.0, 1.0).
### Key Observations
* The ROC curve is significantly above the random guess line, indicating good discriminatory power.
* The AUC value of 0.9468 suggests a high probability that the model will be able to distinguish between positive and negative classes.
* The curve rises quickly initially, indicating that the model can effectively identify true positives with a low false positive rate.
* The curve plateaus at a high TPR, suggesting that the model reaches a point where increasing the threshold does not significantly improve the TPR.
### Interpretation
The ROC curve demonstrates that the binary classification model has excellent performance. The high AUC value (0.9468) indicates that the model is highly effective at distinguishing between the two classes. The curve's position well above the random guess line confirms that the model's predictions are significantly better than chance. The initial steep rise suggests the model is particularly good at identifying true positives without generating many false positives. The plateau indicates that there's a limit to how much the model's performance can be improved by adjusting the classification threshold. This information is crucial for understanding the model's strengths and weaknesses and for selecting an appropriate classification threshold based on the specific application's requirements.