## Stacked Histogram: Confidence vs. Count for Correct and Wrong Answers
### Overview
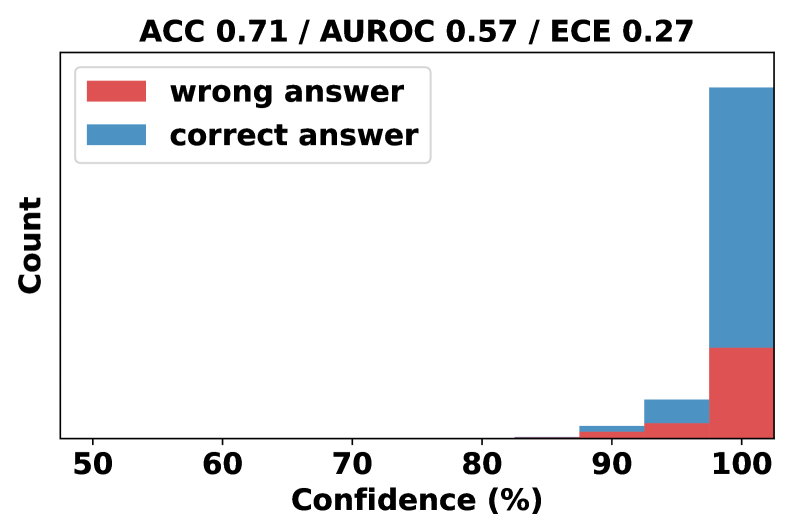
The image is a stacked histogram showing the distribution of confidence levels for correct and wrong answers. The x-axis represents confidence levels in percentage, and the y-axis represents the count. The histogram is stacked, with the count of wrong answers (red) stacked on top of the count of correct answers (blue) for each confidence interval. The title provides overall performance metrics: ACC (Accuracy) = 0.71, AUROC (Area Under the Receiver Operating Characteristic curve) = 0.57, and ECE (Expected Calibration Error) = 0.27.
### Components/Axes
* **Title:** ACC 0.71 / AUROC 0.57 / ECE 0.27
* **X-axis:** Confidence (%) - Ranges from 50 to 100 in increments of 10.
* **Y-axis:** Count
* **Legend:** Located in the top-left corner.
* Red: wrong answer
* Blue: correct answer
### Detailed Analysis
* **Confidence Levels:** The x-axis is marked at 50, 60, 70, 80, 90, and 100.
* **Data Series:**
* **Correct Answers (Blue):** The count of correct answers is very low until the 90-100% confidence range, where it increases dramatically.
* **Wrong Answers (Red):** The count of wrong answers is very low until the 90-100% confidence range, where it increases.
* **Specific Data Points (Approximate):**
* **50-60% Confidence:** Both correct and wrong answers have a count of approximately 0.
* **60-70% Confidence:** Both correct and wrong answers have a count of approximately 0.
* **70-80% Confidence:** Both correct and wrong answers have a count of approximately 0.
* **80-90% Confidence:** Both correct and wrong answers have a count of approximately 0.
* **90-100% Confidence:** The count of correct answers is significantly higher than the count of wrong answers. The count of correct answers is approximately 15, while the count of wrong answers is approximately 3.
### Key Observations
* Most answers, both correct and wrong, are given with high confidence (90-100%).
* The number of correct answers with high confidence is much greater than the number of wrong answers with high confidence.
* The model rarely provides answers with low confidence (50-90%).
### Interpretation
The stacked histogram suggests that the model tends to be more confident in its answers, regardless of whether they are correct or wrong. The high accuracy (ACC = 0.71) indicates that the model is generally correct, but the non-perfect AUROC (0.57) and ECE (0.27) values suggest that the model's confidence is not perfectly calibrated with its actual performance. Specifically, the ECE value of 0.27 indicates that the model is not well-calibrated, meaning that its predicted probabilities do not accurately reflect the true likelihood of correctness. The model is overconfident in some of its predictions.