## Line Chart: Accuracy vs. Attack Ratio for Different Federated Learning Methods
### Overview
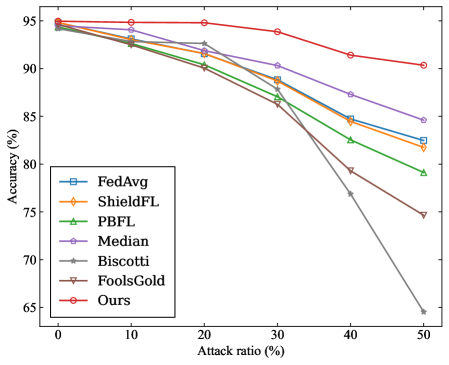
The image is a line chart comparing the accuracy of different federated learning methods as the attack ratio increases. The x-axis represents the attack ratio (percentage), and the y-axis represents the accuracy (percentage). Several federated learning methods are compared, including FedAvg, ShieldFL, PBFL, Median, Biscotti, FoolsGold, and "Ours".
### Components/Axes
* **X-axis:** Attack ratio (%), with markers at 0, 10, 20, 30, 40, and 50.
* **Y-axis:** Accuracy (%), with markers at 65, 70, 75, 80, 85, 90, and 95.
* **Legend:** Located on the left side of the chart, listing the federated learning methods and their corresponding colors/markers:
* FedAvg (blue, square marker)
* ShieldFL (orange, diamond marker)
* PBFL (green, triangle marker)
* Median (purple, pentagon marker)
* Biscotti (gray, star marker)
* FoolsGold (brown, inverted triangle marker)
* Ours (red, circle marker)
### Detailed Analysis
* **FedAvg (blue, square marker):** Starts at approximately 94% accuracy at 0% attack ratio. The accuracy decreases gradually as the attack ratio increases, reaching approximately 82% at 50% attack ratio.
* **ShieldFL (orange, diamond marker):** Starts at approximately 94% accuracy at 0% attack ratio. The accuracy decreases gradually as the attack ratio increases, reaching approximately 82% at 50% attack ratio.
* **PBFL (green, triangle marker):** Starts at approximately 94% accuracy at 0% attack ratio. The accuracy decreases gradually as the attack ratio increases, reaching approximately 79% at 50% attack ratio.
* **Median (purple, pentagon marker):** Starts at approximately 94% accuracy at 0% attack ratio. The accuracy decreases gradually as the attack ratio increases, reaching approximately 84% at 50% attack ratio.
* **Biscotti (gray, star marker):** Starts at approximately 94% accuracy at 0% attack ratio. The accuracy decreases sharply as the attack ratio increases, reaching approximately 65% at 50% attack ratio.
* **FoolsGold (brown, inverted triangle marker):** Starts at approximately 94% accuracy at 0% attack ratio. The accuracy decreases sharply as the attack ratio increases, reaching approximately 74% at 50% attack ratio.
* **Ours (red, circle marker):** Starts at approximately 95% accuracy at 0% attack ratio. The accuracy decreases slightly as the attack ratio increases, reaching approximately 91% at 50% attack ratio.
### Key Observations
* The "Ours" method consistently maintains the highest accuracy across all attack ratios.
* The Biscotti method experiences the most significant drop in accuracy as the attack ratio increases.
* FedAvg, ShieldFL, PBFL, and Median methods show a moderate decrease in accuracy as the attack ratio increases.
* FoolsGold also shows a significant drop in accuracy, though not as severe as Biscotti.
### Interpretation
The chart demonstrates the impact of increasing attack ratios on the accuracy of various federated learning methods. The "Ours" method appears to be the most robust against attacks, maintaining a high level of accuracy even at a 50% attack ratio. Biscotti is the most vulnerable, with its accuracy plummeting as the attack ratio increases. The other methods (FedAvg, ShieldFL, PBFL, and Median) exhibit intermediate levels of resilience. This suggests that the "Ours" method incorporates mechanisms that effectively mitigate the effects of adversarial attacks, while Biscotti lacks such defenses. The performance differences highlight the importance of designing federated learning algorithms that are robust to malicious participants or data manipulation.