## Diagram: Triangular Lattice with Black and White Nodes
### Overview
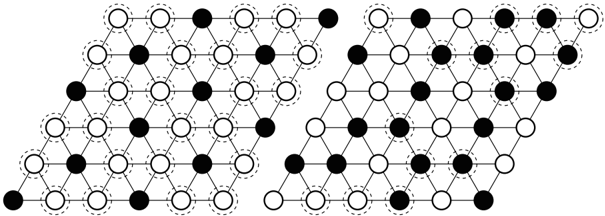
The image depicts two sections of a triangular lattice. The lattice consists of nodes connected by lines, forming equilateral triangles. The nodes are colored either black or white. Dashed circles surround the nodes, possibly indicating a specific region or selection. The two sections are separated by a gap.
### Components/Axes
* **Nodes:** Represented by circles, colored either black or white.
* **Edges:** Represented by straight lines connecting the nodes, forming equilateral triangles.
* **Lattice Structure:** The nodes and edges form a repeating triangular pattern.
* **Dashed Circles:** Encircle each node.
* **Sections:** The diagram is split into two distinct sections, separated by a gap.
### Detailed Analysis
**Left Section:**
* The left section starts with a single black node at the bottom.
* The next row has two nodes, one white and one black.
* The subsequent rows alternate between black and white nodes, creating a pattern.
* The top row has several nodes, with the rightmost node being black.
**Right Section:**
* The right section begins with two white nodes at the bottom.
* The nodes alternate between black and white, similar to the left section.
* The top row has several nodes, with the rightmost node being white.
**Node Color Distribution:**
* The distribution of black and white nodes appears somewhat random, but there might be underlying patterns.
* Both sections exhibit a mix of black and white nodes.
### Key Observations
* The diagram showcases a triangular lattice structure.
* The nodes are colored black and white, potentially representing different states or properties.
* The dashed circles around the nodes might indicate a selection or highlight.
* The two sections are separated, suggesting a break or discontinuity in the lattice.
### Interpretation
The diagram likely represents a system or model where nodes in a triangular lattice can exist in two states (black or white). The lattice structure could represent physical connections or interactions between the nodes. The dashed circles might indicate nodes that are being considered or analyzed. The separation into two sections could represent different regions or conditions within the system. Without further context, it's difficult to determine the specific meaning or purpose of the diagram, but it could be related to topics such as:
* Statistical physics (e.g., Ising model on a triangular lattice)
* Materials science (e.g., arrangement of atoms in a crystal)
* Graph theory (e.g., coloring of nodes in a graph)