## Bar Charts: DCCA Coefficient and Station Distribution by Latitude
### Overview
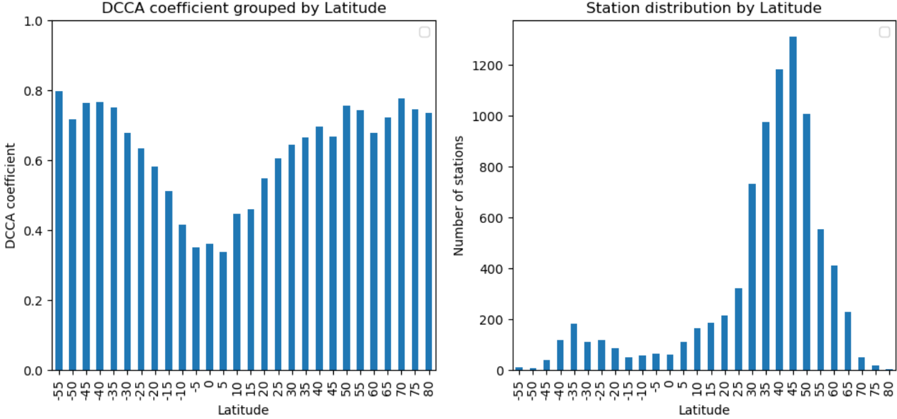
The image contains two adjacent bar charts comparing latitude-based distributions. The left chart shows DCCA coefficients (a statistical measure) across latitudes, while the right chart displays the number of monitoring stations at each latitude. Both use 5-degree latitude bins from -55° to 80°.
### Components/Axes
**Left Chart (DCCA Coefficient):**
- **X-axis**: Latitude (-55° to 80° in 5° increments)
- **Y-axis**: DCCA coefficient (0.0 to 1.0)
- **Bars**: Blue, grouped by latitude
- **Title**: "DCCA coefficient grouped by Latitude"
**Right Chart (Station Distribution):**
- **X-axis**: Latitude (-55° to 80° in 5° increments)
- **Y-axis**: Number of stations (0 to 1400)
- **Bars**: Blue, grouped by latitude
- **Title**: "Station distribution by Latitude"
**Legend**: Located in the top-right corner of both charts. Single blue color entry labeled "Stations" (right chart) and implied "DCCA Coefficient" (left chart).
### Detailed Analysis
**DCCA Coefficient Values (Left Chart):**
- **-55°**: ~0.80
- **-45°**: ~0.75
- **-40°**: ~0.72
- **-35°**: ~0.68
- **-30°**: ~0.62
- **-25°**: ~0.55
- **-20°**: ~0.48
- **-15°**: ~0.40
- **-10°**: ~0.35
- **-5°**: ~0.33
- **0°**: ~0.32
- **5°**: ~0.34
- **10°**: ~0.42
- **15°**: ~0.45
- **20°**: ~0.50
- **25°**: ~0.55
- **30°**: ~0.60
- **35°**: ~0.65
- **40°**: ~0.68
- **45°**: ~0.72
- **50°**: ~0.75
- **55°**: ~0.70
- **60°**: ~0.68
- **65°**: ~0.65
- **70°**: ~0.78
- **75°**: ~0.72
- **80°**: ~0.70
**Station Distribution (Right Chart):**
- **-55°**: ~5
- **-45°**: ~30
- **-40°**: ~50
- **-35°**: ~80
- **-30°**: ~100
- **-25°**: ~120
- **-20°**: ~150
- **-15°**: ~200
- **-10°**: ~250
- **-5°**: ~300
- **0°**: ~400
- **5°**: ~450
- **10°**: ~500
- **15°**: ~600
- **20°**: ~700
- **25°**: ~800
- **30°**: ~900
- **35°**: ~1000
- **40°**: ~1100
- **45°**: ~1200
- **50°**: ~1000
- **55°**: ~900
- **60°**: ~800
- **65°**: ~600
- **70°**: ~400
- **75°**: ~200
- **80°**: ~50
### Key Observations
1. **DCCA Coefficient Trends**:
- Peaks at extreme latitudes (-55°, 70°, 80°) with values ~0.75-0.80.
- Minimum values cluster near the equator (0°-10°) at ~0.32-0.35.
- Gradual increase from -55° to 45°, followed by a decline toward 80°.
2. **Station Distribution Trends**:
- Symmetrical peak at 45° (~1200 stations), tapering toward poles and equator.
- Highest density between 35°-45° (1000-1200 stations).
- Sparse stations at extreme latitudes (-55° to -45° and 75°-80°).
### Interpretation
The data reveals an inverse relationship between station density and DCCA coefficients:
- **High DCCA Coefficients** (0.7-0.8) occur in regions with **fewer stations** (extreme latitudes), suggesting these areas may have stronger temporal correlations despite sparse monitoring.
- **Low DCCA Coefficients** (0.3-0.4) near the equator (0°-10°) coincide with **moderate station density** (~300-400 stations), indicating potential data limitations or environmental variability.
- The station distribution peak at 45° (~1200 stations) aligns with mid-latitude regions, possibly due to geographic accessibility or population density.
This pattern implies that DCCA coefficients may reflect both environmental factors and data availability, with sparse stations in extreme latitudes potentially amplifying perceived correlations.