\n
## Diagram: Bacterial Colony Observations
### Overview
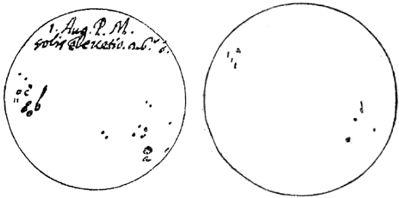
The image presents two circular diagrams, likely representing petri dishes or similar growth media, with scattered dark dots indicating bacterial colonies. Each diagram is labeled with text, and some colonies within the left diagram are marked with letters. The image appears to be a historical scientific record of bacterial growth patterns.
### Components/Axes
The image consists of two circular areas, each representing a growth medium. The left circle has text at the top and labeled colonies. The right circle is unlabeled except for the colonies themselves. There are no explicit axes or scales.
### Detailed Analysis or Content Details
**Left Circle:**
* **Label:** "1. Aug. P.M. solir. Heretic. c.s." (English translation: "1. August Post Meridiem [after noon]. Soil. Heretic. c.s.")
* Colonies are scattered throughout the circle, with a higher concentration towards the bottom-right quadrant.
* Three colonies are labeled:
* "a" - Located in the top-left quadrant.
* "b" - Located slightly below and to the right of "a".
* "c" - Located in the bottom-right quadrant.
* A fourth colony is labeled "2" in the bottom-right quadrant.
**Right Circle:**
* The circle contains a smaller number of colonies, concentrated towards the top-left quadrant.
* There are four colonies labeled with numbers:
* "1" - Located in the top-left quadrant.
* "2" - Located slightly below and to the right of "1".
* "3" - Located in the bottom-right quadrant.
* "4" - Located slightly above and to the left of "3".
The size of the dots representing colonies appears relatively consistent within each diagram, suggesting similar growth rates or colony sizes.
### Key Observations
* The left circle shows a greater density of colonies compared to the right circle.
* The distribution of colonies differs between the two circles. The left circle has a more dispersed pattern, while the right circle has a more localized concentration.
* The labeling on the left circle suggests a specific experimental setup involving soil samples ("solir") and a designation ("Heretic"). The "c.s." is unclear without further context.
* The time stamp "Aug. P.M." indicates the observation was made in the afternoon of August.
### Interpretation
The image likely represents a comparative study of bacterial growth in different conditions or from different sources. The left circle, with its detailed labeling and higher colony count, may represent a primary experimental sample. The right circle could be a control sample or a variation of the experiment. The labeling of individual colonies ("a", "b", "c", "1", "2", "3", "4") suggests the researcher was tracking the growth of specific strains or observing morphological differences. The term "Heretic" is intriguing and could refer to a specific type of soil or a particular experimental condition considered unconventional at the time. The image provides a snapshot of early microbiological research, demonstrating the methods used to observe and document bacterial growth before the advent of modern techniques. The lack of quantitative data (e.g., colony counts, measurements) limits a more precise interpretation, but the visual differences in colony density and distribution suggest meaningful variations in growth conditions or bacterial populations.