\n
## Line Chart: Accuracy vs. Reasoning Hops
### Overview
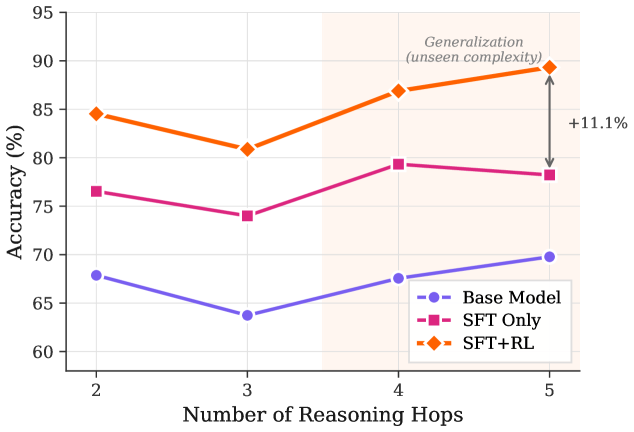
This line chart depicts the relationship between the number of reasoning hops and the accuracy of three different models: a Base Model, an SFT (Supervised Fine-Tuning) Only model, and an SFT+RL (Reinforcement Learning) model. The chart illustrates how accuracy changes as the complexity of reasoning increases, indicated by the number of reasoning hops. A shaded region in the upper-right corner highlights the "Generalization (unseen complexity)" and a corresponding accuracy increase of +11.1%.
### Components/Axes
* **X-axis:** Number of Reasoning Hops (ranging from 2 to 5).
* **Y-axis:** Accuracy (%) (ranging from 60% to 95%).
* **Data Series:**
* Base Model (Blue, dashed circle line)
* SFT Only (Magenta, dashed square line)
* SFT+RL (Orange, dashed diamond line)
* **Legend:** Located in the bottom-right corner, clearly labeling each data series with its corresponding color and marker.
* **Annotation:** "Generalization (unseen complexity)" with "+11.1%" positioned in the top-right corner, indicating an accuracy improvement.
### Detailed Analysis
* **Base Model (Blue):** The line starts at approximately 69% accuracy at 2 reasoning hops, decreases to around 64% at 3 hops, and then gradually increases to approximately 70% at 5 hops. The trend is generally flat with a slight dip in the middle.
* **SFT Only (Magenta):** The line begins at approximately 76% accuracy at 2 reasoning hops, decreases to around 74% at 3 hops, increases to approximately 80% at 4 hops, and then slightly decreases to around 79% at 5 hops. This line shows a more pronounced increase between 3 and 4 hops.
* **SFT+RL (Orange):** The line starts at approximately 85% accuracy at 2 reasoning hops, decreases to around 81% at 3 hops, and then increases sharply to approximately 87% at 4 hops, and then slightly decreases to around 86% at 5 hops. This line consistently demonstrates the highest accuracy across all reasoning hops.
**Specific Data Points (approximate):**
| Reasoning Hops | Base Model (%) | SFT Only (%) | SFT+RL (%) |
|---|---|---|---|
| 2 | 69 | 76 | 85 |
| 3 | 64 | 74 | 81 |
| 4 | 68 | 80 | 87 |
| 5 | 70 | 79 | 86 |
### Key Observations
* The SFT+RL model consistently outperforms both the Base Model and the SFT Only model across all reasoning hops.
* The Base Model exhibits the lowest accuracy and the most fluctuating performance.
* All models show a dip in accuracy at 3 reasoning hops, potentially indicating a point of increased complexity.
* The largest performance gain for the SFT+RL model occurs between 3 and 4 reasoning hops.
* The annotation highlights a significant generalization improvement of +11.1% at 5 reasoning hops, specifically related to unseen complexity.
### Interpretation
The data suggests that incorporating Reinforcement Learning (RL) into Supervised Fine-Tuning (SFT) significantly improves the model's ability to handle complex reasoning tasks. The SFT+RL model demonstrates a clear advantage in accuracy, particularly as the number of reasoning hops increases, indicating a better capacity for generalization to unseen complexities. The dip in accuracy at 3 reasoning hops for all models could represent a threshold where the reasoning process becomes more challenging, requiring more sophisticated learning techniques. The +11.1% generalization improvement at 5 hops further emphasizes the benefits of the SFT+RL approach for tackling complex, real-world problems. The Base Model's lower performance suggests that simply scaling up the model size or training data may not be sufficient to achieve high accuracy in complex reasoning scenarios; targeted fine-tuning and reinforcement learning are crucial.