## Scatter Plot Matrix: Principal Component Projections for Token "3"
### Overview
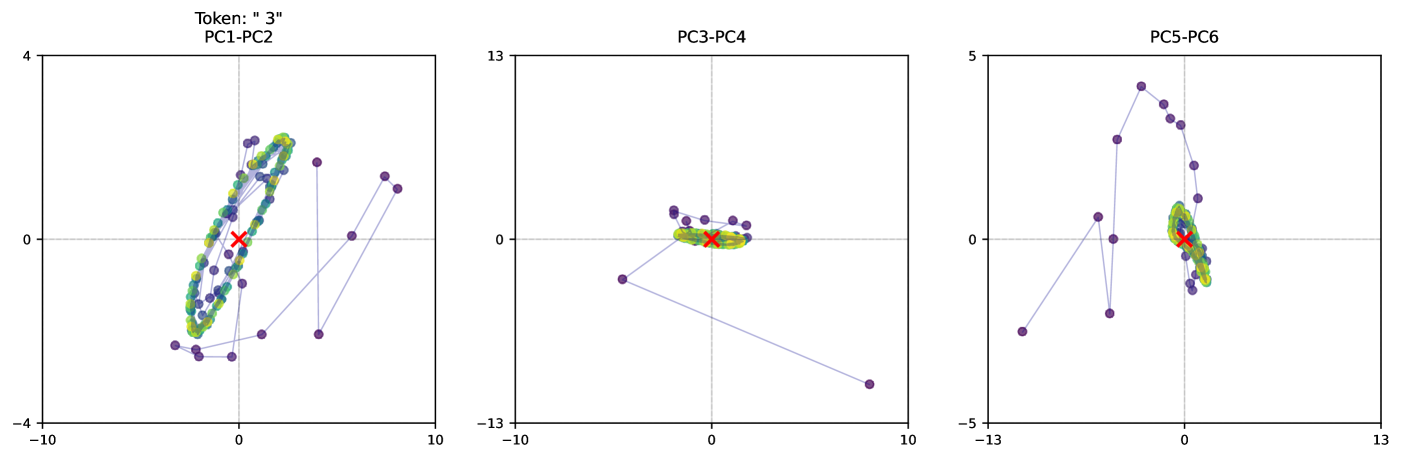
The image displays three horizontally arranged scatter plots, each visualizing data points projected onto different pairs of principal components (PCs). The overall title indicates the data pertains to a specific token labeled "3". The plots show two distinct data series: a dense, clustered series (green/yellow) and a sparse, connected series (purple) that forms a trajectory. A red 'X' marks the origin (0,0) in each plot.
### Components/Axes
* **Overall Title:** "Token: '3'" (Top-center, above the first plot).
* **Plot 1 (Left):**
* **Title:** "PC1-PC2"
* **X-axis:** Label "PC1", range approximately -10 to 10, with major ticks at -10, 0, 10.
* **Y-axis:** Label "PC2", range approximately -4 to 4, with major ticks at -4, 0, 4.
* **Grid:** Dashed gray lines at x=0 and y=0.
* **Plot 2 (Center):**
* **Title:** "PC3-PC4"
* **X-axis:** Label "PC3", range approximately -10 to 10, with major ticks at -10, 0, 10.
* **Y-axis:** Label "PC4", range approximately -13 to 13, with major ticks at -13, 0, 13.
* **Grid:** Dashed gray lines at x=0 and y=0.
* **Plot 3 (Right):**
* **Title:** "PC5-PC6"
* **X-axis:** Label "PC5", range approximately -13 to 13, with major ticks at -13, 0, 13.
* **Y-axis:** Label "PC6", range approximately -5 to 5, with major ticks at -5, 0, 5.
* **Grid:** Dashed gray lines at x=0 and y=0.
* **Data Series:**
* **Series A (Green/Yellow):** A dense cluster of points, appearing as a gradient from green to yellow, centered tightly around the origin (0,0) in all plots.
* **Series B (Purple):** A set of discrete purple points connected by thin, light purple lines, forming a continuous path or trajectory.
* **Reference Marker:** A red 'X' at coordinate (0,0) in each plot.
### Detailed Analysis
**Plot 1 (PC1-PC2):**
* **Green/Yellow Cluster:** Forms an elongated, dense oval shape primarily aligned along the PC2 axis. It spans roughly from PC1 = -2 to 2 and PC2 = -3 to 3.
* **Purple Trajectory:** The path starts in the lower-left quadrant (approx. PC1=-5, PC2=-3), moves upward and rightward through the green cluster, loops in the upper-right quadrant (approx. PC1=8, PC2=2), and returns. It shows significant variance along both PC1 and PC2.
**Plot 2 (PC3-PC4):**
* **Green/Yellow Cluster:** Very tightly clustered around the origin, forming a small, dense blob. Its spread is minimal, roughly within +/- 2 on both PC3 and PC4.
* **Purple Trajectory:** Shows much greater dispersion. One segment extends from near the origin to a point far in the lower-right quadrant (approx. PC3=8, PC4=-12). Another segment is in the upper-left quadrant. The trajectory is less coherent than in PC1-PC2.
**Plot 3 (PC5-PC6):**
* **Green/Yellow Cluster:** Again tightly clustered near the origin, with a slight vertical elongation along PC6. Spread is roughly within +/- 1 on PC5 and +/- 2 on PC6.
* **Purple Trajectory:** Forms a distinct, tall, narrow loop primarily in the upper half of the plot (positive PC6). It reaches a peak near PC6=4.5 and has a point far to the left (approx. PC5=-10, PC6=-2).
### Key Observations
1. **Dimensionality Reduction:** The data for token "3" has been projected onto six principal components. The variance explained by each successive pair of components appears to decrease (note the shrinking scale of the green cluster).
2. **Two Distinct Patterns:** The visualization clearly separates a stable, central distribution (green/yellow cluster) from a dynamic, exploratory path (purple trajectory). The purple path consistently moves away from and returns to the central cluster.
3. **Trajectory Complexity:** The purple trajectory is most structured and loop-like in PC1-PC2 and PC5-PC6, suggesting meaningful movement in these subspaces. It is most scattered and outlier-prone in PC3-PC4.
4. **Origin as Anchor:** The red 'X' at (0,0) and the dense green cluster around it suggest the origin represents the mean or canonical representation of the token in this PC space. The purple path represents deviations from this mean.
### Interpretation
This visualization likely represents the internal state or activation path of a machine learning model (e.g., a transformer) for a specific token ("3") as it is processed through layers or attention steps. The **green/yellow cluster** probably represents the token's embedding or representation at a stable point (e.g., initial embedding or final output). The **purple trajectory** likely traces the token's evolving representation through intermediate layers or processing steps.
The plots suggest that while the token's core identity (green cluster) remains stable and centered, its contextual representation (purple path) undergoes significant, non-linear transformations, especially in the subspaces defined by PC1-PC2 and PC5-PC6. The large deviation in PC3-PC4 might indicate a specific processing step that causes a significant but temporary shift in the representation. The return of the purple path toward the origin in all plots implies the model's processing ultimately refines the representation back toward a stable state. This is a visual metaphor for how context modulates meaning in a neural network.