\n
## Line Chart: Overall Accuracy (%)
### Overview
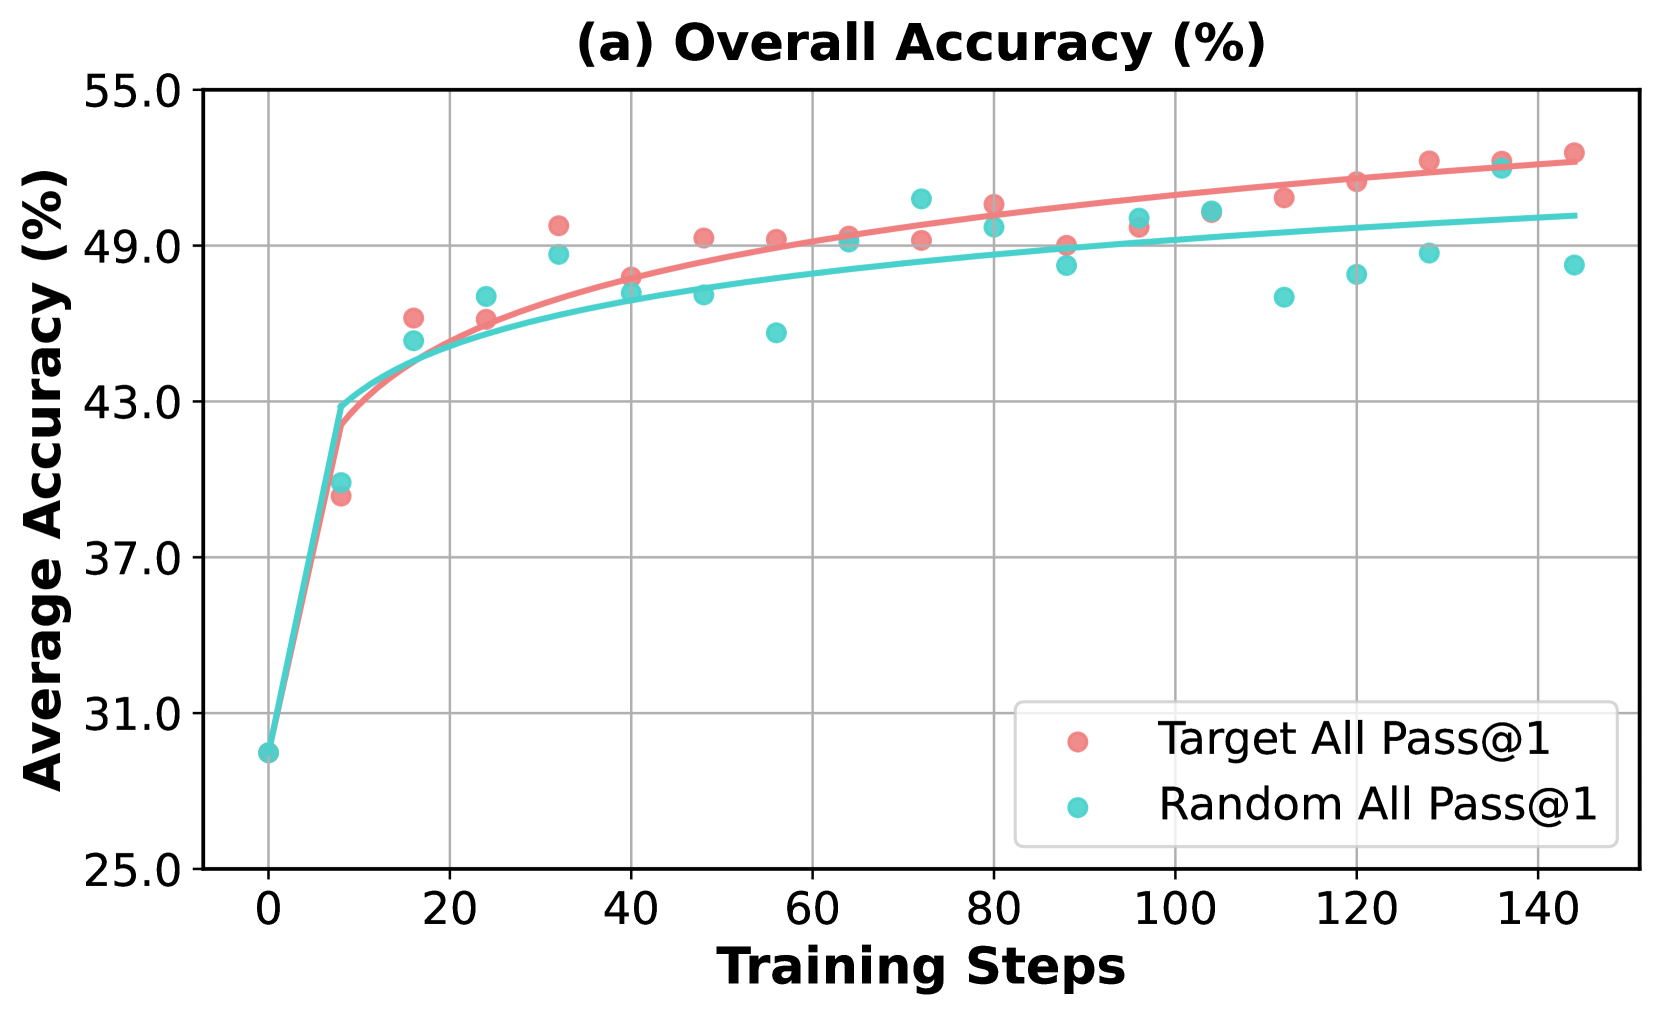
This image presents a line chart illustrating the relationship between Training Steps and Average Accuracy (%). Two data series are plotted: "Target All Pass@1" and "Random All Pass@1". The chart aims to demonstrate how accuracy changes as the training progresses for both approaches.
### Components/Axes
* **Title:** (a) Overall Accuracy (%) - positioned at the top-center.
* **X-axis:** Training Steps - ranging from approximately 0 to 150, with markers at 0, 20, 40, 60, 80, 100, 120, and 140.
* **Y-axis:** Average Accuracy (%) - ranging from approximately 25.0 to 55.0, with markers at 25.0, 30.0, 35.0, 40.0, 45.0, 50.0, and 55.0.
* **Legend:** Located in the bottom-right corner.
* "Target All Pass@1" - represented by a reddish-pink color.
* "Random All Pass@1" - represented by a teal color.
* **Data Series:** Two lines with corresponding data points.
### Detailed Analysis
**Target All Pass@1 (Reddish-Pink):**
The line representing "Target All Pass@1" shows an upward trend, starting at approximately 38% accuracy at 0 training steps. It increases steadily, reaching around 45% at 20 steps, 47% at 40 steps, 49% at 60 steps, 50% at 80 steps, 51% at 100 steps, 52% at 120 steps, and finally reaching approximately 53% at 140 training steps. The data points are scattered around the line, indicating some variance.
* (0, 38%)
* (20, 45%)
* (40, 47%)
* (60, 49%)
* (80, 50%)
* (100, 51%)
* (120, 52%)
* (140, 53%)
**Random All Pass@1 (Teal):**
The line representing "Random All Pass@1" also exhibits an upward trend, but with a steeper initial increase. It starts at approximately 31% accuracy at 0 training steps, rapidly increasing to around 43% at 20 steps. The growth slows down, reaching approximately 46% at 40 steps, 48% at 60 steps, 49% at 80 steps, 48% at 100 steps, 47% at 120 steps, and finally reaching approximately 49% at 140 training steps. The data points are also scattered around the line.
* (0, 31%)
* (20, 43%)
* (40, 46%)
* (60, 48%)
* (80, 49%)
* (100, 48%)
* (120, 47%)
* (140, 49%)
### Key Observations
* Both "Target All Pass@1" and "Random All Pass@1" demonstrate increasing accuracy with more training steps.
* "Random All Pass@1" shows a more rapid initial increase in accuracy compared to "Target All Pass@1".
* The accuracy growth for both series appears to plateau after approximately 80 training steps.
* "Target All Pass@1" consistently achieves higher accuracy than "Random All Pass@1" throughout the training process.
### Interpretation
The chart suggests that both training approaches ("Target All Pass@1" and "Random All Pass@1") are effective in improving accuracy. However, the "Target All Pass@1" approach consistently outperforms the "Random All Pass@1" approach, indicating that targeting specific training examples leads to better results. The plateauing of accuracy after 80 training steps suggests that further training may yield diminishing returns. The initial steep increase in "Random All Pass@1" could indicate faster learning in the early stages, but the "Target All Pass@1" approach ultimately achieves higher overall accuracy. The scatter of data points around the lines indicates some variability in the results, which could be due to factors such as the specific training data or the randomness inherent in the training process.