## Line Chart: Overall Accuracy (%) vs. Training Steps
### Overview
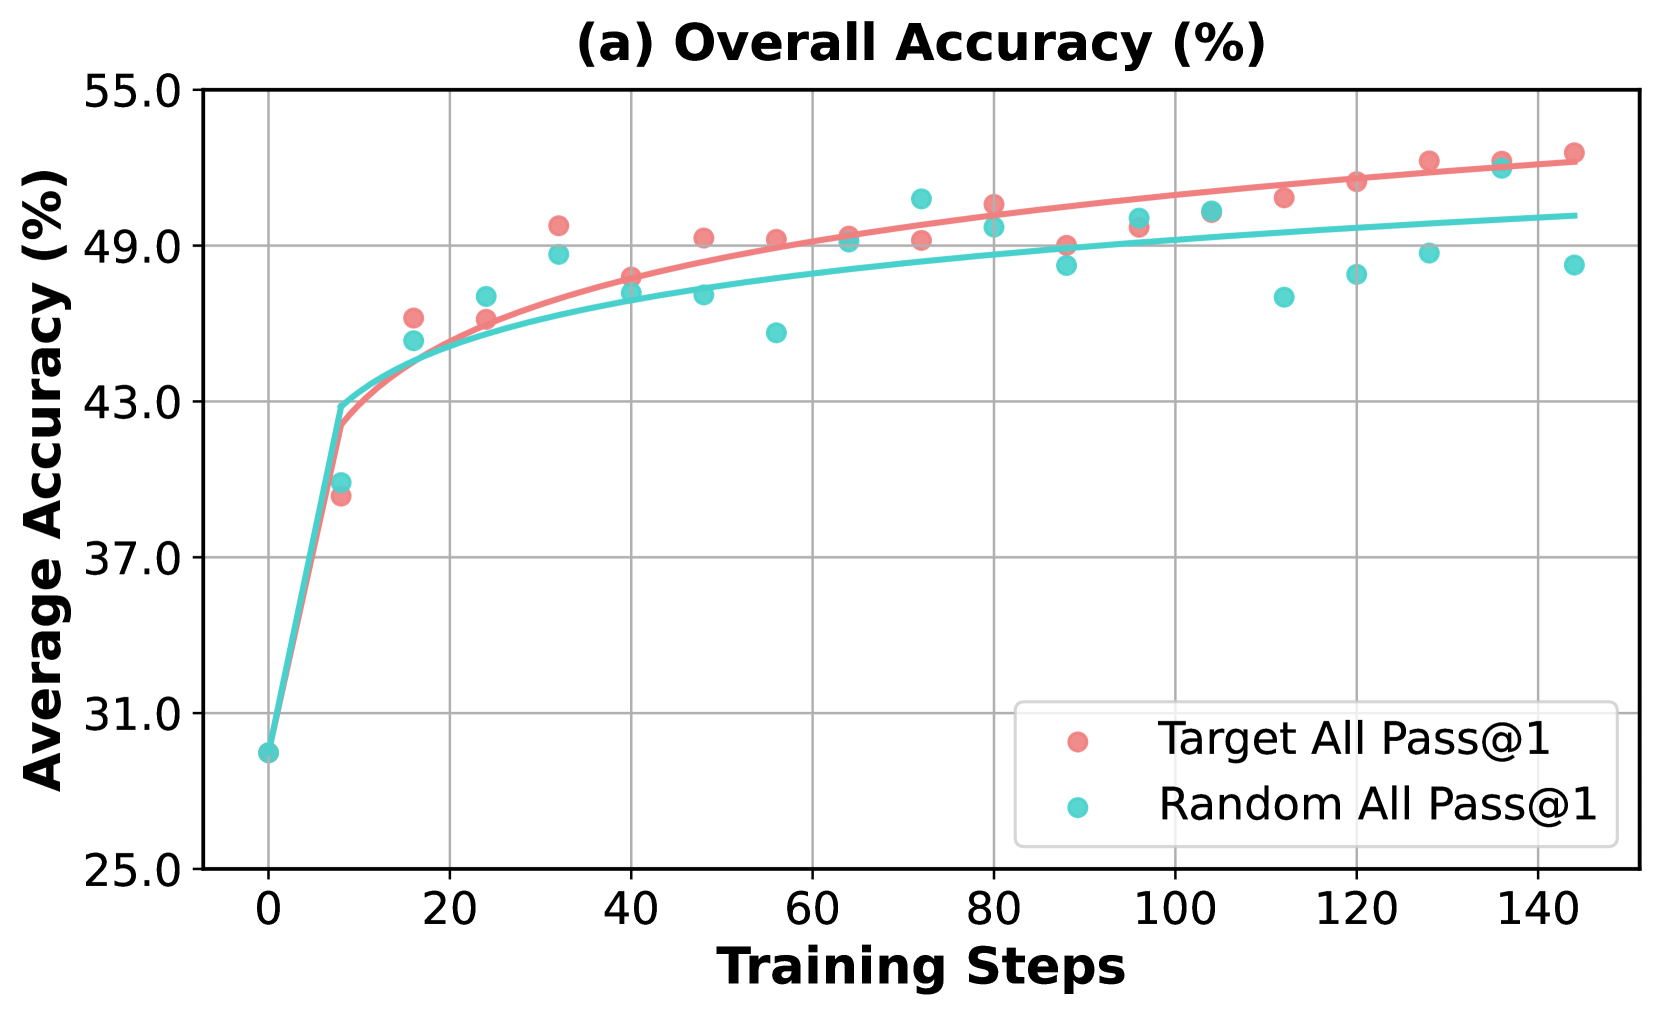
The image is a line chart titled "(a) Overall Accuracy (%)". It plots the average accuracy (in percentage) of two different methods or conditions against the number of training steps. The chart shows a learning curve where accuracy increases rapidly at first and then gradually plateaus for both series.
### Components/Axes
* **Title:** "(a) Overall Accuracy (%)" (centered at the top).
* **Y-Axis:** Labeled "Average Accuracy (%)". The scale runs from 25.0 to 55.0, with major tick marks at 25.0, 31.0, 37.0, 43.0, 49.0, and 55.0.
* **X-Axis:** Labeled "Training Steps". The scale runs from 0 to 140, with major tick marks at 0, 20, 40, 60, 80, 100, 120, and 140.
* **Legend:** Located in the bottom-right quadrant of the chart area. It contains two entries:
* A pink/salmon-colored circle labeled "Target All Pass@1".
* A teal/cyan-colored circle labeled "Random All Pass@1".
* **Data Series:** Two series are plotted, each consisting of individual data points (circles) and a fitted trend line.
* **Target All Pass@1 (Pink):** Data points and a solid pink trend line.
* **Random All Pass@1 (Teal):** Data points and a solid teal trend line.
* **Grid:** A light gray grid is present, aligned with the major tick marks on both axes.
### Detailed Analysis
**Trend Verification:**
* **Target All Pass@1 (Pink Line):** The trend line shows a steep, concave-down increase from step 0 to approximately step 20, after which the slope becomes much shallower, continuing a steady, near-linear increase through step 140.
* **Random All Pass@1 (Teal Line):** The trend line follows a very similar shape to the pink line—a steep initial rise followed by a gradual increase. However, its slope in the later stages (steps 40-140) is slightly less steep than the pink line's slope.
**Data Point Extraction (Approximate Values):**
The following table lists approximate accuracy values for each data point, read from the chart. Uncertainty is ±1.0% due to visual estimation.
| Training Steps | Target All Pass@1 (Pink) Accuracy (%) | Random All Pass@1 (Teal) Accuracy (%) |
| :--- | :--- | :--- |
| 0 | ~29.0 | ~29.0 |
| 10 | ~39.0 | ~40.0 |
| 15 | ~46.0 | ~45.0 |
| 20 | ~46.5 | ~47.0 |
| 25 | ~49.5 | ~49.0 |
| 30 | ~48.0 | ~47.5 |
| 40 | ~49.0 | ~47.0 |
| 50 | ~49.0 | ~46.0 |
| 55 | ~49.5 | ~49.0 |
| 65 | ~49.5 | ~51.0 |
| 75 | ~50.0 | ~48.5 |
| 80 | ~50.0 | ~49.5 |
| 90 | ~49.5 | ~50.0 |
| 95 | ~50.5 | ~50.5 |
| 105 | ~51.0 | ~47.0 |
| 115 | ~51.5 | ~48.0 |
| 120 | ~52.0 | ~49.0 |
| 130 | ~52.5 | ~52.0 |
| 140 | ~52.5 | ~48.5 |
**Spatial Grounding & Cross-Reference:**
* The legend is positioned in the bottom-right, clearly associating the pink color with "Target All Pass@1" and the teal color with "Random All Pass@1".
* Visual confirmation: The pink trend line and its associated data points are consistently positioned above the teal trend line and its points after approximately step 15, confirming the legend mapping is correct.
### Key Observations
1. **Rapid Initial Learning:** Both methods show a dramatic increase in accuracy from step 0 to step ~20, jumping from ~29% to the mid-40% range.
2. **Performance Gap:** After the initial phase (post step ~20), the "Target All Pass@1" (pink) series consistently achieves higher accuracy than the "Random All Pass@1" (teal) series. The gap appears to widen slightly as training progresses.
3. **Plateauing Effect:** The rate of improvement for both series slows significantly after step 40, indicating diminishing returns from additional training steps.
4. **Data Variance:** The individual data points for both series show scatter around their respective trend lines, indicating some variance in performance at different training steps. The "Random" series (teal) appears to have slightly more variance, with a notable low outlier at step 105 (~47.0%).
### Interpretation
This chart demonstrates the learning efficiency of two different approaches ("Target" vs. "Random") over the course of model training. The "Target All Pass@1" method is superior, achieving a higher final accuracy (~52.5% vs. ~48.5% at step 140) and maintaining a consistent lead throughout most of the training process after the initial steps.
The similar shape of the curves suggests both methods benefit from training in a comparable way—rapid early gains followed by refinement. The persistent gap indicates that the "Target" strategy provides a more effective learning signal or optimization path than the "Random" strategy. The plateau suggests that further significant gains beyond ~50-53% accuracy would require either more training steps (with potentially minimal improvement) or a fundamental change to the model or training method. The variance in the "Random" series might imply less stable or reliable training compared to the "Target" method.