## Line Chart: Dev Accuracy Comparison (PQK vs. Finetune)
### Overview
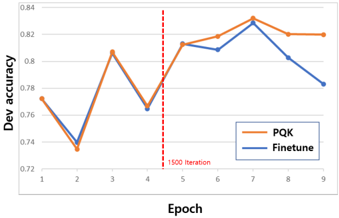
The image is a line chart comparing the development set accuracy ("Dev accuracy") of two machine learning training methods, labeled "PQK" and "Finetune," over a series of training epochs. The chart includes a vertical dashed line marking a specific iteration milestone.
### Components/Axes
* **Chart Type:** Line chart with two data series.
* **X-Axis:**
* **Label:** "Epoch"
* **Scale:** Linear, integer markers from 1 to 9.
* **Y-Axis:**
* **Label:** "Dev accuracy"
* **Scale:** Linear, ranging from 0.72 to 0.84, with major gridlines at intervals of 0.02.
* **Legend:**
* **Position:** Bottom-right corner of the plot area.
* **Series 1:** "PQK" - Represented by an orange line.
* **Series 2:** "Finetune" - Represented by a blue line.
* **Annotations:**
* A vertical red dashed line is positioned between Epoch 4 and Epoch 5 (approximately at x=4.5).
* Text label next to the red line: "1500 iteration".
### Detailed Analysis
**Data Series Trends & Approximate Points:**
1. **PQK (Orange Line):**
* **Trend:** Shows significant volatility in early epochs, with a general upward trend after Epoch 4, peaking at Epoch 7 before a slight decline.
* **Approximate Data Points:**
* Epoch 1: ~0.775
* Epoch 2: ~0.735 (local minimum)
* Epoch 3: ~0.805 (local peak)
* Epoch 4: ~0.780
* Epoch 5: ~0.815
* Epoch 6: ~0.820
* Epoch 7: ~0.830 (global maximum)
* Epoch 8: ~0.820
* Epoch 9: ~0.820
2. **Finetune (Blue Line):**
* **Trend:** Follows a very similar volatile pattern to PQK for the first 7 epochs, closely tracking it. After Epoch 7, it diverges with a sharp downward trend.
* **Approximate Data Points:**
* Epoch 1: ~0.770
* Epoch 2: ~0.740 (local minimum)
* Epoch 3: ~0.805 (local peak, matches PQK)
* Epoch 4: ~0.765
* Epoch 5: ~0.815 (matches PQK)
* Epoch 6: ~0.810
* Epoch 7: ~0.825 (global maximum, slightly below PQK)
* Epoch 8: ~0.805
* Epoch 9: ~0.785
**Key Spatial & Visual Relationships:**
* The two lines are nearly superimposed from Epoch 1 to Epoch 7, indicating very similar performance during this phase.
* The red "1500 iteration" line at Epoch 4.5 appears to mark a transition point. After this line, both methods show a more consistent upward climb until Epoch 7.
* The most significant divergence occurs after Epoch 7, where the PQK line plateaus while the Finetune line declines steeply.
### Key Observations
1. **High Correlation Pre-Divergence:** The performance of PQK and Finetune is almost identical for the first 7 epochs, suggesting they respond similarly to training data up to that point.
2. **Post-Peak Divergence:** After reaching their respective peaks at Epoch 7, the methods behave differently. PQK maintains its accuracy (~0.82), while Finetune's accuracy degrades significantly (dropping ~0.04 by Epoch 9).
3. **Volatility:** Both methods exhibit a "sawtooth" pattern in early epochs (dips at Epoch 2 and 4), which may indicate instability in training or the effect of specific data batches.
4. **Milestone Marker:** The "1500 iteration" annotation suggests a change in training protocol (e.g., switching from a pre-training to a fine-tuning phase, adjusting learning rate) occurred at that point, after which both models began a more sustained improvement.
### Interpretation
This chart likely illustrates a comparison between a novel training method (PQK) and a standard fine-tuning approach. The data suggests:
* **Initial Parity:** For the majority of the training process (up to Epoch 7), PQK performs equivalently to standard fine-tuning. This demonstrates that PQK is a viable alternative that does not sacrifice performance during the main training phase.
* **Superior Stability/Generalization:** The critical finding is the behavior after Epoch 7. The fact that PQK's accuracy plateaus at a high level while Finetune's drops suggests that PQK may lead to a more robust model that is less prone to **overfitting** on the development set as training continues. The Finetune method's decline could indicate it is beginning to memorize training data at the expense of generalizability.
* **The "1500 iteration" Point:** This marker is crucial context. It implies the experiment was designed with a two-stage process. The improved, steadier climb for both models after this point indicates the protocol change was effective. The subsequent divergence highlights PQK's advantage in the later, potentially more delicate, stages of optimization.
**Conclusion:** The chart provides evidence that the PQK method matches the performance of standard fine-tuning during active learning and may offer significant advantages in maintaining model performance and preventing degradation in later training stages, leading to a more stable and potentially better-generalizing final model.