## Bar Chart and Flow Diagram: Publications on Transformers and Their Development
### Overview
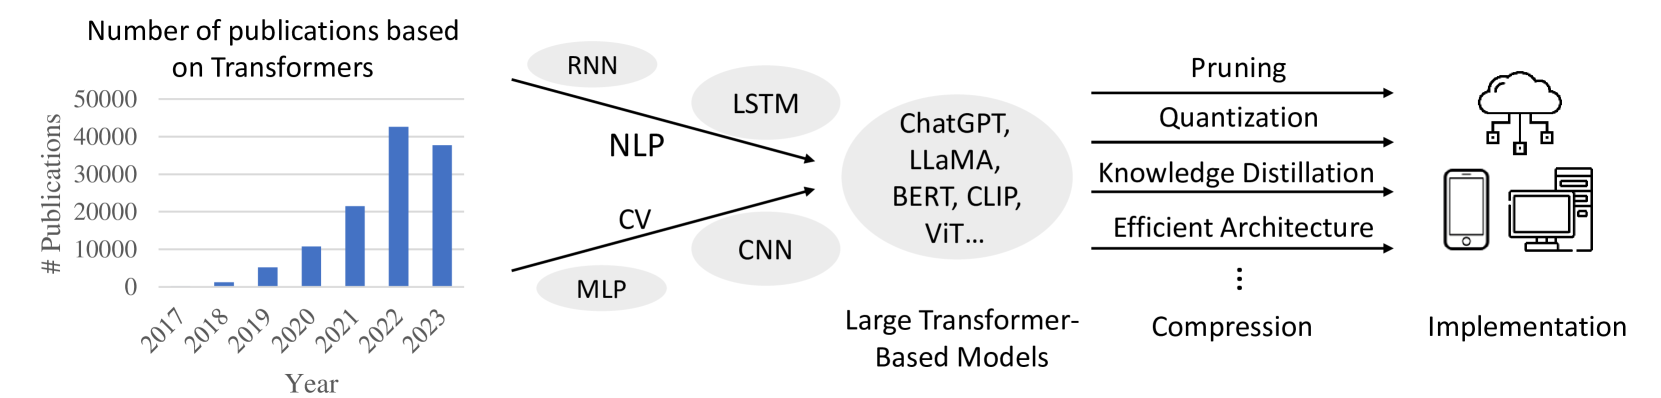
This image presents two distinct but related sections. The left section is a bar chart showing the number of publications based on Transformers over the years from 2017 to 2023. The right section is a flow diagram illustrating the progression from various model types and applications to large Transformer-based models, followed by compression techniques, and finally, implementation on different devices.
### Components/Axes
**Bar Chart:**
* **Title:** "Number of publications based on Transformers"
* **Y-axis Title:** "# Publications"
* **Y-axis Scale:** Ranges from 0 to 50,000, with major tick marks at 0, 10,000, 20,000, 30,000, 40,000, and 50,000.
* **X-axis Title:** "Year"
* **X-axis Markers:** 2017, 2018, 2019, 2020, 2021, 2022, 2023.
**Flow Diagram:**
* **Input Categories (Left):**
* Ovals containing: "RNN", "NLP", "CV", "CNN", "MLP". Arrows point from these towards "Large Transformer-Based Models".
* **Intermediate Stage:**
* A large oval labeled "Large Transformer-Based Models" containing text: "ChatGPT, LLaMA, BERT, CLIP, ViT...".
* **Compression Techniques (Middle):**
* A list of techniques with arrows pointing from "Large Transformer-Based Models" to them, and then to "Implementation":
* "Pruning"
* "Quantization"
* "Knowledge Distillation"
* "Efficient Architecture"
* "..." (ellipsis indicating more techniques)
* "Compression" (positioned below the ellipsis, suggesting it's a broader category or a related concept).
* **Output Stage (Right):**
* Icons representing implementation:
* A cloud icon with connected squares, representing cloud-based implementation.
* A smartphone icon.
* A desktop computer icon.
* A label below these icons: "Implementation".
### Detailed Analysis or Content Details
**Bar Chart Data:**
The bar chart displays the following approximate publication counts for each year:
* **2017:** Approximately 1,000 publications.
* **2018:** Approximately 2,000 publications.
* **2019:** Approximately 8,000 publications.
* **2020:** Approximately 22,000 publications.
* **2021:** Approximately 42,000 publications.
* **2022:** Approximately 42,000 publications.
* **2023:** Approximately 38,000 publications.
**Flow Diagram Progression:**
The flow diagram illustrates a conceptual pathway:
1. **Foundation Models/Applications:** Traditional model types and application areas like RNN, NLP, CV, CNN, and MLP are shown as inputs that contribute to or are related to the development of Transformer models.
2. **Emergence of Large Transformer Models:** These foundational elements lead to the development of significant Transformer-based models, exemplified by names like ChatGPT, LLaMA, BERT, CLIP, and ViT.
3. **Optimization and Efficiency:** To make these large models practical, various compression and efficiency techniques are applied, including Pruning, Quantization, Knowledge Distillation, and the development of Efficient Architectures. The ellipsis and "Compression" label suggest this is a multifaceted area.
4. **Deployment:** The final stage is "Implementation," depicted by icons for cloud, mobile, and desktop/server environments, indicating the diverse platforms where these optimized Transformer models can be deployed.
### Key Observations
* **Exponential Growth in Publications:** The bar chart clearly shows a dramatic increase in the number of publications related to Transformers, particularly from 2019 to 2021, indicating a surge in research and development in this area.
* **Peak and Slight Decline:** While publications peaked around 2021-2022, there's a slight decrease in 2023, which could be a temporary fluctuation or an indication of a maturing research field or a shift in focus.
* **Interconnectedness of AI Fields:** The flow diagram highlights how older AI paradigms (RNN, CNN, MLP) and application domains (NLP, CV) paved the way for or are integrated with the rise of Transformer models.
* **Focus on Practicality:** The inclusion of compression techniques underscores the ongoing effort to make powerful Transformer models more efficient and deployable across various hardware and software environments.
### Interpretation
The image effectively communicates the trajectory of Transformer-based models in artificial intelligence. The bar chart quantifies the explosive growth in research interest and output concerning Transformers, demonstrating their significant impact on the AI landscape. The rapid ascent from 2019 to 2021 suggests a paradigm shift driven by the capabilities of these models.
The flow diagram provides a conceptual framework for understanding the evolution and application of Transformers. It suggests that while foundational AI concepts and models were crucial, the advent of large Transformer architectures like BERT and GPT has revolutionized the field. The subsequent emphasis on compression and efficient implementation highlights the practical challenges and ongoing innovations required to translate these powerful models into real-world applications across diverse platforms, from cloud services to personal devices. The diagram implies a progression from theoretical development and model creation to optimization and widespread deployment, reflecting the maturity and impact of Transformer technology. The slight dip in publications in 2023, while needing further context, could indicate a stabilization after rapid growth or a transition to more applied research and deployment rather than foundational exploration.